
How a global energy services enterprise unlocked 7x the workload value on the same platform spend.
Every enterprise data leader has heard the pitch by now. Microsoft Fabric is the future. Migrate your Power BI workloads, consolidate your Azure services, and step into the era of unified analytics.
The slide decks are polished. The roadmap looks compelling.
But one question is rarely answered directly.
Are you paying the same money for the same dashboards running on a different engine? Or does something fundamentally shift in what your data platform can do for the business?
This is the story of what happened when a global, publicly listed oilfield and energy services provider decided to find out. Not in a proof of concept. Not in a sandbox. In production, across multiple continents, with real business outcomes on the line.
The answer was unexpected, not because the migration failed, but because it proved to be only the beginning.
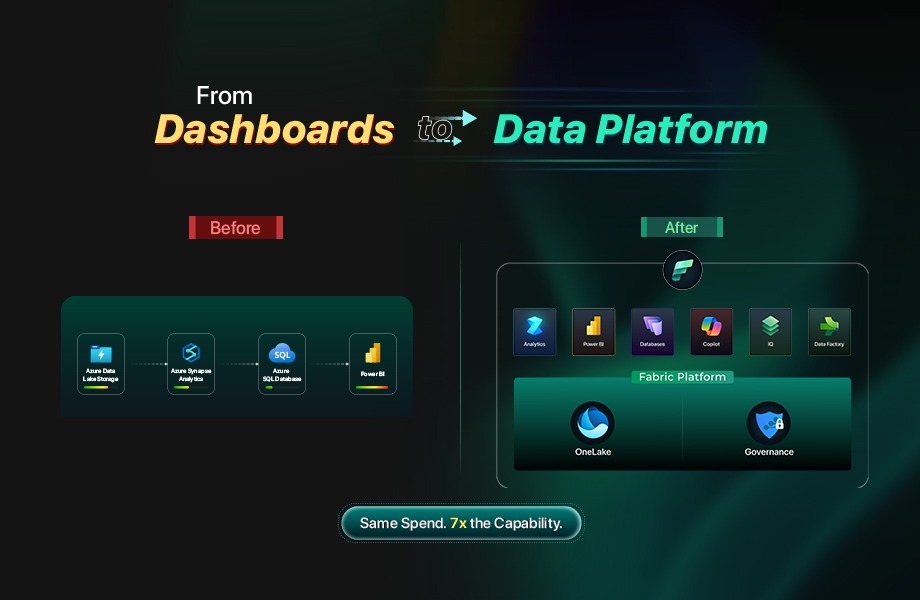
The Starting Point: $15,000 a Month for Dashboards
In early 2024, this organization, a FTSE 250-listed energy services company with approximately 2,000 to 2,500 employees operating across roughly a dozen countries, ran its entire analytics operation on Microsoft Power BI Premium. The setup was straightforward: a P1 capacity at roughly $5,000 per month, backed by an Azure Synapse Data Lake and Azure SQL Database adding another $10,000 per month.
That $15,000 monthly spend supported one thing: business intelligence dashboards. From a finance perspective, the investment was stable, but its functional scope was narrow. The backend infrastructure existed to feed Power BI. Every component served a single purpose. And every component was running near maximum utilization. There was no room to grow, no elasticity for new workloads, and no path to do anything beyond refresh reports on a schedule.
For a global enterprise managing precision-engineered equipment, connection technology, and well intervention tools across North America, Europe, the Middle East, and Asia-Pacific, this was a bottleneck hiding in plain sight. The data existed. The questions existed. The platform simply could not accommodate anything beyond its original mandate.
The Migration That Was Not the Story
The decision to move to Microsoft Fabric happened in 2024. Over the following year and a half, the environment reached stable production maturity. If you measured success by whether reports still worked and costs stayed in line, the project was a clean win.
But that framing misses the point entirely. If all you do is move Power BI Premium workloads into Fabric and call it a day, you have executed the data equivalent of moving money from your left pocket to your right pocket. The reports look the same. The dashboards behave the same. The invoice is about the same. Nothing has changed except the logo on the architecture diagram.
The real story of this transformation is not about what was migrated. It is about what became possible after the platform was in place, and what the business started asking for once the foundation could actually support it.
That story unfolds in seven layers. The first two are the foundation that nobody sees but everything depends on. The next five are the capabilities that changed how the business operates.
Part I: The Foundation
The foundation layers are structural. They are invisible to most of the business. Nobody walks into a quarterly review and celebrates a medallion architecture or a CI/CD pipeline. But without them, nothing built on top is scalable, trustworthy, or sustainable. These layers answer one question: is this platform built right, and can the enterprise trust it?
Layer 1: Central Data Strategy: The Medallion Architecture
Before anything else could change, the organization had to confront a structural reality: the old environment was not a data platform. It was plumbing. Data moved from ERPs into a staging area, got transformed just enough to populate Power BI datasets, and stopped. There was no central data strategy. There was no architecture designed for reuse, scalability, or expansion. There was a pipeline that served one purpose.
The first and most consequential decision in the Fabric transformation was to replace this approach with a deliberate medallion architecture built on OneLake.
Raw data from source systems lands in the bronze layer with minimal transformation, preserving the full fidelity of what ERPs, operational systems, and transactional databases produce. The silver layer applies business logic, cleansing, deduplication, and standardization, creating a governed, consistent representation of enterprise data that is source-system agnostic. The gold layer contains consumption-ready datasets shaped for specific business domains and use cases.
This is not a technical footnote. This is the architectural decision that made everything else in this story possible.
The medallion structure is designed to scale horizontally. When a new ERP or system comes online in a new geography, it connects to bronze. When a new business domain needs analytics, it adds more transformation and views in silver. When a new use case emerges, whether reporting, machine learning, or application backends, it can build on bronze, silver or gold based on the grain of information needed. The architecture does not need to be redesigned for each new demand. It was built to absorb them.
In the old environment, adding a new data source meant building a new pipeline end to end. In the medallion environment, it means connecting another input to bronze and letting the existing architecture carry it forward. For a company operating across roughly a dozen countries with multiple information systems instances, that difference is the difference between a platform that can grow and one that becomes more fragile with every addition.
Layer 2: Governance and Trust: CI/CD, Git, and Compliance
A central data architecture is only as valuable as the trust the organization places in it. For a publicly listed company with financial reporting obligations, SOX compliance requirements, and audit expectations, that trust is not established by good intentions. It is established by engineering discipline.
The organization implemented a full governance and deployment framework built on Azure DevOps with Git-based version control. Every change to the data platform, whether a transformation in the medallion layers, a modification to a semantic model, or an update to a report, follows a defined CI/CD pipeline. Changes are versioned, reviewed, tested, and deployed through controlled processes rather than applied directly to production.
This may sound like a technical hygiene initiative. It is not. For any enterprise where financial data feeds board reports, regulatory filings, or operational decision-making, the question is never just “is the data right?” The question is “can you prove the data is right, and can you prove that the process that produced it is controlled and auditable?” In environments where financial data informs capital allocation, debt strategy, or investor communication, that proof becomes strategic, not procedural.
Without this layer, the medallion architecture remains structured storage. With it, it becomes a governed, auditable enterprise asset.
The governance framework also created a practical benefit that extended beyond compliance. With CI/CD pipelines in place, the pace of development accelerated. Teams could iterate on the platform, deploy changes safely, and roll back if needed. The same discipline that made the platform trustworthy also made it faster to build on. Governance did not slow things down. It gave the organization the confidence to move faster.
Part II: The Capability Layers
With the foundation in place, a governed medallion architecture in OneLake and auditable deployment pipelines ensuring trust, the platform was ready to do more than serve dashboards. The capability layers are what the business actually experienced. Each one represents a new category of value that only became possible because the layers before it existed.
Layer 3: Analytics Modernization: Direct Lake
The first capability the business noticed was not a new application or a new model. It was something that disappeared.
In the old environment, Power BI operated in Import Mode. Datasets were bulk-refreshed on a schedule, sometimes hourly, sometimes daily. Between refreshes, the data was stale. Every refresh consumed processing capacity, competed with other workloads, and imposed a rhythm on the BI team’s operations that had nothing to do with the business and everything to do with platform limitations. Managing refresh schedules, troubleshooting failures, and optimizing dataset sizes were ongoing operational burdens that consumed time without producing insight.
With the medallion architecture in place and gold-layer datasets curated in OneLake, the organization transitioned to Direct Lake connectivity. Direct Lake allows Power BI to read directly from OneLake without importing data into a separate dataset. The refresh cycle, the operational overhead it carried, and the staleness it imposed simply went away.
Reports now reflect data as current as what sits in OneLake. The BI team’s operational rhythm shifted from managing refreshes to improving analytics. System resource consumption dropped because Fabric was no longer duplicating data into import datasets. And for business users, the experience changed in a way they could feel: the numbers were current, the reports were faster, and the lag between “something happened” and “I can see it in the data” compressed dramatically.
Direct Lake is not a marginal improvement to Power BI. It is a fundamentally different operating model for enterprise analytics, and it is only possible when the underlying data architecture, the medallion layers in OneLake, is built to support it. Layer 1 created the structure. Layer 3 is the first visible return on that investment.
Layer 4: Operational Applications: The Platform Becomes a Backend
The first signal that something had fundamentally shifted came not from the analytics team, but from the business operations side. Teams building internal applications using Microsoft PowerApps needed a transactional backend. In the old environment, this would have meant spinning up a separate Azure SQL instance, managing another set of credentials, and maintaining yet another silo of data disconnected from the analytics layer.
With Fabric SQL Database available as part of the unified platform, the conversation changed. PowerApps could write directly to a backend that also fed the analytics layer. Operational tracking applications for internal workflows were built with Fabric as their foundation, meaning the data those applications generated was immediately available for reporting and analysis without additional ETL pipelines, data movement, or reconciliation.
At this point, Fabric evolved from an analytics environment into operational infrastructure. The distinction is structural: one observes the business, the other supports how it runs. And once the business realized that Fabric could serve as both, the requests started accelerating.
Layer 5: Predictive Intelligence: From Forecasting to Autonomous Action
With operational and historical data flowing through a unified, governed layer, the organization moved into territory that the original Power BI environment could never have supported. Data science entered the platform.
5A: Payment Prediction and Cash Forecasting
The first data science initiative was built for the Treasury department. Payment prediction models were developed to analyze customer and vendor payment patterns, drawing on transactional data, historical trends, and operational signals that were now accessible in one place through the medallion architecture.
Instead of finance analysts manually assembling spreadsheets from multiple systems to estimate when receivables would land or when payables would come due, machine learning models could now evaluate those patterns at scale. Automated cash-flow forecasting gave Treasury the ability to anticipate liquidity positions rather than simply react to them.
For a global energy services company managing complex payment cycles across multiple geographies and currencies, the shift from descriptive reporting to predictive intelligence represented a material operational advantage. The finance team moved from asking “what happened last quarter?” to asking “what should we expect next month?” The data had always existed to answer that question. What had been missing was a platform capable of bringing it together and a foundation trustworthy enough for finance to rely on the output. The shift was from retrospective reporting to forward-looking liquidity management.
5B: Cost Prediction and Autonomous Alerting
The second stage of predictive intelligence took the foundation from 5A and extended it. Where payment prediction models delivered forecasts for humans to review and act on, the next initiative closed the loop.
Cost prediction models were deployed alongside autonomous agents capable of detecting anomalies, identifying threshold breaches, and triggering alerts and notifications without human initiation. This was not a scheduled report emailed on Monday morning. This was a system that monitored conditions continuously and acted when intervention was warranted.
This is where the organization is currently pushing the frontier. The models are in active development and delivery, and the ambition is clear: a platform that does not just tell you what will happen but responds when it does.
Layer 6: Conversational AI: Dashboard to Dialogue
Every analytics platform faces the same adoption challenge: the people who need data the most are often the people least likely to open a Power BI report. They do not know which dashboard to find. They do not know how to filter it. They do not have time to learn. So they ask someone else, wait for an email, or make decisions without data entirely.
With rich, governed, multi-domain data consolidated in OneLake, the organization deployed data agents. These conversational AI interfaces allowed business users to interact with enterprise data using natural language queries. Instead of navigating to a specific report and applying the right filters, a user could simply ask a question and receive an answer grounded in the same governed data that powered the dashboards.
This layer did not replace Power BI. It extended the platform’s reach to an entirely new audience. The people who were already comfortable with dashboards continued using them. The people who never opened a report now had a way in. The total addressable user base for the data platform expanded significantly, and it happened without building a single new dashboard.
The trustworthiness of the responses depended directly on the foundation layers. Conversational AI is only as reliable as the data it draws from. Because that data was organized through a medallion architecture, governed through CI/CD pipelines, and curated into gold-layer datasets, the agents could deliver answers with a level of confidence that would not have been possible against ungoverned, fragmented data sources.
Layer 7: Bidirectional Integration (Reverse ETL): The Platform Becomes a Hub
Up to this point, every layer followed a familiar pattern: data flows into the platform, and insights or actions flow out. Layer 7 reversed the direction.
With OneLake established as a centralized data repository receiving near-real-time ERP data, the organization implemented reverse ETL workflows. Data that had been synchronized into Fabric was now pushed back outward into operational systems. One of the first use cases was HR software integration, where punch-in and punch-out tracking data flowed from OneLake into downstream workforce management tools.
This established a fundamentally different architectural role for the platform. Fabric was no longer just a destination where data arrived for analysis. It became a distribution hub, a central nervous system that both received and transmitted data across the enterprise technology landscape. Operational systems that had previously maintained their own isolated data stores could now draw from a single governed source.
For a company operating manufacturing, service, and distribution facilities across multiple continents, this kind of centralized data distribution had been an aspiration for years. The technology to do it had existed in theory, but the practical barrier had always been the same: too many systems, too many integration points, too much fragmentation. OneLake, structured through the medallion architecture and governed through auditable pipelines, changed the economics of that equation.
This layer also opened a conversation about consolidation. Distributed Power BI and SQL-based edge systems, many of which had been maintained independently or on-premises across the organization’s global facilities, could now be considered for centralization. The objective was not to eliminate local systems for the sake of it, but to bring them under a unified governance model and reduce the fragmentation that had accumulated over years of organic growth.
The $15,000 Question
Here is the part that makes data leaders do a double-take.
After all seven layers were in production or active development, after the platform had evolved from a single-purpose dashboard tool into a multi-disciplinary enterprise data platform supporting a central medallion architecture, governed CI/CD deployment, Direct Lake analytics, operational application backends, predictive finance models with autonomous alerting, conversational AI agents, and bidirectional data integration, the monthly platform spend settled back to approximately the same $15,000 baseline where it started.
Same budget. Seven layers of capability where there used to be one. And unlike the original environment, where every component was running near maximum utilization, the Fabric-based architecture had meaningful capacity headroom remaining. The platform was not full. It was ready for whatever the business asked for next.
This is not a cost savings story. It is a value density story. The question was never “can we spend less?” The question was “can we get dramatically more from what we spend?” The answer, demonstrated in production at enterprise scale, is yes.
The Difference Between Migration and Transformation
Every Microsoft partner in the Fabric ecosystem can help you migrate Power BI Premium workloads into Fabric. The reports will work. The dashboards will render. The architecture diagram will update.
But migration is not even a layer. It is the entry ticket. And if your Fabric journey ends at migration, you have moved data from your left pocket to your right pocket. You have a cleaner architecture, maybe some performance improvements, and a modernized label on the same capability you had before.
The organizations that extract real, compounding value from Fabric are the ones that treat migration as the starting line. They invest in the foundation: a central data strategy that can scale and a governance framework that the enterprise can trust. Then they build capability layers on top. Each layer answers a question that only emerged because the previous layer existed. Each layer expands what the platform can do and who it can serve. And each layer increases the return on a platform investment that was already in place.
For enterprise leaders, the decision is no longer whether unified analytics is coming. It is whether the organization will treat Fabric as a reporting environment or as core infrastructure. The depth of that choice determines whether the platform remains a cost center or becomes a strategic asset.
This account is based on a real enterprise engagement. Company details have been generalized to protect client confidentiality.


