For many finance teams, Power BI is the default reporting platform. Dashboards are widely used and great for exploration. But when teams try to produce core financial statements like the P&L and balance sheet, the experience often becomes fragile: layouts shift, exports drift, and the process turns into a cycle of workarounds.
If that sounds familiar, it is a sign that the reporting format does not match the reporting requirement.
What are Power BI Paginated Reports, and why finance teams use them
Paginated Reports are a traditional reporting engine embedded inside the Power BI ecosystem. Think of Paginated Reports as the modern successor to SSRS, the same proven reporting technology finance teams have relied on for years – but natively integrated into Power BI and Fabric. For a deeper dive, see Why Power BI Paginated Reports – Precision, Compliance, and Pixel-Perfect Reporting
In practice, this means:
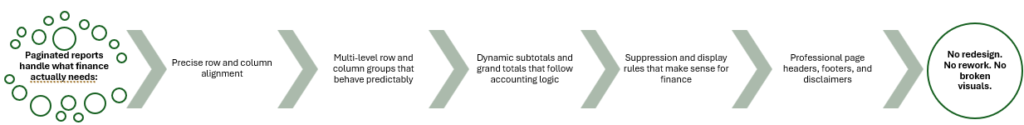
- Precise formatting by design
- Multi-page output
- Controlled column widths and row heights
- Predictable pagination
- Repeatable layouts
You design the report knowing exactly how page 1, page 10, and page 200 will render.
How Power BI Paginated Reports produce financial statements
Using Tablix structures, Paginated Reports enforce financial hierarchies by design – controlling indentation, subtotals, and page headers at the document level. The result is true document engineering: multi-page financial statements with fixed layouts, aligned numbers, and consistent outputs across PDF, Excel, and print – without visual drift or recalculation risk.
- Indented Hierarchies: Precisely control spacing and font weight to clearly distinguish summary lines (e.g., Revenue) from detail rows (e.g., Sales – Services).
- Fixed Columns: Lock “Current Year” and “Prior Year” columns so they never shift or resize, regardless of screen resolution or export format.
- Custom Subtotals: Place subtotals exactly where finance expects them -above or below detail rows – with distinct formatting such as background shading and font weight.
- Single Definition: Use one report definition to generate both consolidated and parameter-driven financial statements, ensuring consistent layouts with no duplicated reports, no copy-paste logic, and no layout drift between departments.
As shown in the example below, this Income Statement was built using sample Contoso data to demonstrate how a true Income Statement is rendered using Power BI Paginated Reports. Every element in the report – from individual line items to key financial metrics like Gross Profit, Gross Margin %, Net Revenue, EBITDA, and EBITDA Margin % – is intentionally formatted based on its financial meaning.
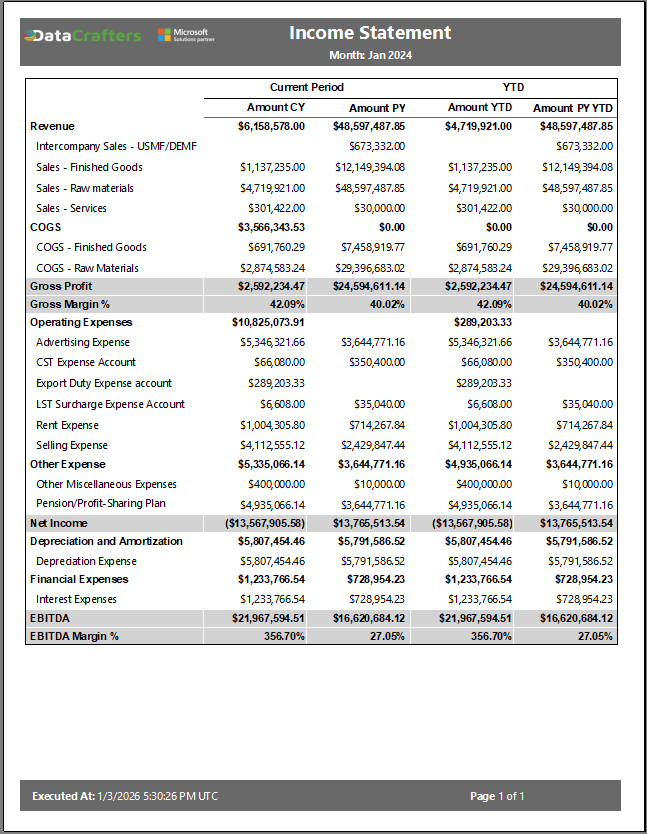
Numeric measures such as Gross Profit, Net Revenue and EBITDA are treated as calculated financial amounts, while margins are rendered as percentages with appropriate precision and emphasis. This formatting is applied directly at the report level using native Paginated Report capabilities – no hacks, and no complex manipulation.
The only prerequisites are clean data and a well-defined financial mapping that defines hierarchy and presentation rules. Once that foundation exists, the reporting layer becomes deterministic and repeatable.
This report was built on a Power BI finance semantic model, which provides a practical advantage: core calculations like current period, prior period, and year-to-date are defined once and reused consistently across statements.
The same report definition can also be built directly against a source database, such as a Fabric Warehouse, using SQL. In that case, calculation logic may shift from DAX to SQL, while the report layout and formatting stay consistent.
Conclusion: Where Power BI Paginated Reports fit in finance reporting
Power BI Paginated Reports complement dashboards by addressing a different reporting need. Dashboards work well for analysis, exploration, and decision support. Financial statements require stable layouts, consistent totals, and repeatable outputs that hold up across PDF, Excel, and print.
Paginated Reports support that standard with a single definition, controlled formatting, and deterministic presentation, whether the data comes from a semantic model or directly from an enterprise source.
For organizations already invested in Power BI and Fabric, the capability is already there. The real decision is architectural: define which outputs are documents and which outputs are analytical experiences, then design each one accordingly.
This approach reduces rework, lowers audit and board-pack risk, and keeps finance reporting on schedule.