In Part 1 of this series, we mapped the manufacturing supply chain end to end and looked at revenue, closing stock, and production volume at the company level. Efficiency at that level is only half of the picture. The other half comes down to a question operations and finance teams ask every week: are our suppliers reliable, and is our inventory positioned to meet demand without tying up more working capital than it needs to.
Our Supply Chain Management Dashboard gives a real-time lens into both. Built in Power BI, it brings supplier scorecards and inventory positioning into one place and ties the numbers back to IAS 2 (Inventories), the same standard we anchored Part 1 to. Under IAS 2, the cost of inventories includes purchase price plus transport, handling, and other costs directly attributable to bringing goods to their present location [IAS 2, Para 10-11] – which means supplier terms flow directly into how inventory is valued on the balance sheet. US readers can map this to ASC 330, the equivalent US GAAP guidance.
In this blog post we discuss supplier performance and inventory management strategies – two of the four areas we flagged at the end of Part 1. Supplier performance and inventory both sit on the same side of the Cash Conversion Cycle (CCC): slower, less reliable supplier lead times stretch Days Inventory Outstanding (DIO), and DIO is one of the three legs of the formula (CCC = DIO + DSO – DPO) that ties operations back to cash.
If you haven’t already, it is worth reading our other dashboard breakdowns: the Accounts Receivable Dashboard, the Inventory Management Dashboard, and the Accounts Payable Dashboard – together they cover the full CCC.
Our Supply Chain Management Dashboard Phase 2 has been designed to answer questions such as:
- How reliable are our suppliers, in terms of on-time delivery and defect rate?
- Which suppliers and sourcing countries carry the highest procurement risk?
- How much inventory are we holding across warehouses and categories, and is it enough to cover demand?
- When should we reorder, and how much safety stock do we need?
- How does supplier lead time affect Days Inventory Outstanding?
- How do these operational metrics tie back to IAS 2 inventory costing?
- Which segments, regions, and suppliers need closer attention right now?
Architecture and data:
How the data moves
| SharePoint | → | Dataflow Gen2 (CI/CD) | → | MS Fabric Lakehouse | → | Views | → | Semantic model | → | Power BI report |
*Transformation stays in the dataflow, so the semantic model carries relationships, measures, and visuals only. All the data sets we made own our own as sample data, not from any ERP. But it provides real data structures.
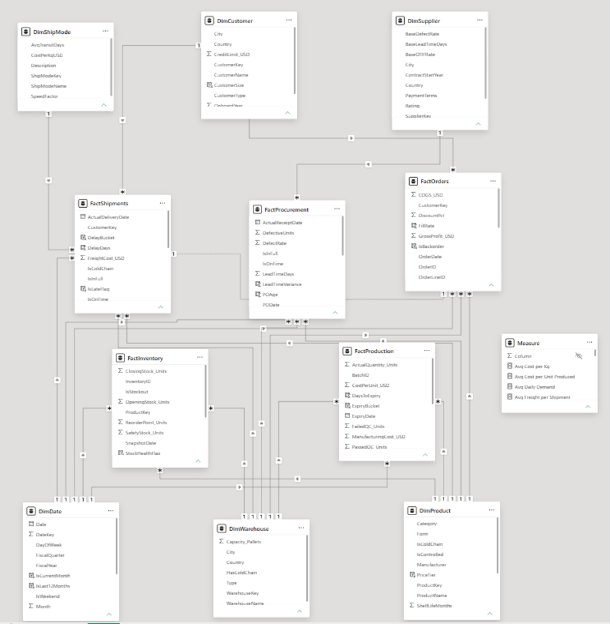
| Fact table | Customer | Date | Product | Ship mode | Supplier | Warehouse |
| FactInventory | SnapshotDate | ProductKey | WarehouseKey | |||
| FactOrders | CustomerKey | OrderDate | ProductKey | WarehouseKey | ||
| FactProcurement | PODate | ProductKey | SupplierKey | WarehouseKey | ||
| FactProduction | ProductionDate | ProductKey | WarehouseKey | |||
| FactShipments | CustomerKey | ShipDate | ProductKey | ShipModeKey | WarehouseKey |
*Columns are the six dimension tables; each cell shows the fact-side key that joins to it. Every relationship is one-to-many from the dimension and filters in a single direction. One inactive, bidirectional relationship links FactShipments[OrderID] to FactOrders[OrderID].
What Is Supplier Performance Management?
Supplier performance management is the ongoing measurement of how well vendors meet cost, quality, and delivery commitments. It is less about picking the cheapest supplier and more about picking the one that keeps showing up on time, with the right quality, order after order.
That distinction carries real cost: a supplier can look great on price and still cost you a stockout six months later.
Key Definitions
- Lead Time – the number of days between placing a purchase order and receiving the goods.
- On-Time Delivery % – the share of orders that arrive on or before the promised date.
- Defect Rate % – the share of received units that fail quality inspection. Directly affects write-downs under IAS 2 when defective stock can no longer be sold at cost.
- Safety Stock – the buffer inventory held to cover demand or lead time variability.
- Reorder Point – the inventory level that triggers a new purchase order.
- Days Inventory Outstanding (DIO) – the average number of days inventory sits before it is sold.
The Business Case for Supplier and Inventory Visibility
- Real-Time Visibility – see supplier scorecards and stock positions as they change, rather than at month-end close.
- Cost Control – procurement cost and carrying cost are large, controllable levers; small percentage improvements move real dollars.
- Risk Mitigation – concentrated sourcing or an unreliable supplier can halt production; visibility surfaces this before it becomes a shortage.
- Compliance – costs directly attributable to inventory acquisition belong in its cost under IAS 2, so procurement data needs to reach the finance team accurately.
- Strategic Planning – lead time and defect rate data feed both supplier negotiations and reorder point planning.
Who Uses This Dashboard?
- Procurement and Supply Chain Managers – for supplier scorecarding and sourcing decisions.
- Finance Teams and Controllers – for inventory valuation and cost of goods sold accuracy.
- Warehouse and Inventory Managers – for reorder timing and stock positioning.
- Executive Leadership – for network-level risk and working capital oversight.
Supplier Performance: On-Time Delivery, Defect Rates, and Procurement Spend
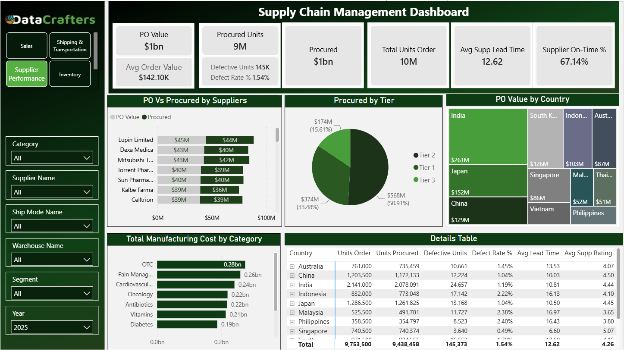
All KPIs on this dashboard are filtered to fiscal year 2025.
Decision Impact:
- Improve On-Time Delivery: at 67.14%, that is roughly one in three orders arriving late. Tighten SLAs with whichever suppliers are driving that shortfall before it disrupts production schedules.
- Reduce Defect Exposure: track the 145K defective units by supplier to target root causes rather than treating 1.54% as a single number.
- Close the Order-to-Procurement Gap: follow up on the roughly 1M-unit gap between orders placed and units procured.
- Standardize Order Sizes: use the $142.10K average order value to flag suppliers whose order patterns deviate significantly.
PO Value vs. Procured Value by Supplier
Decision Impact:
- Maintain Lupin Limited as the Top Volume Partner: highest PO value at $45M against $44M procured, only a $1M shortfall.
- Focus on Sun Pharma and Celltrion: both show the tightest match between ordered and procured value ($40M/$40M and $39M/$39M), the most dependable fulfillment in this group.
- Monitor Dexa Medica: a $3M gap between $43M ordered and $40M procured is worth tracking before it turns into a stockout risk.
- Investigate Kalbe Farma’s Shortfall: $39M ordered against $36M procured is the widest gap among these suppliers and needs direct conversation.
Procurement Concentration by Supplier Tier
Decision Impact:
- Diversify Away from Tier 3 Concentration: Tier 3 suppliers account for 50.91% ($568M) of procurement spend; a disruption here carries outsized risk.
- Strengthen Tier 1 Relationships: at 33.48% ($374M) of spend, Tier 1 suppliers likely offer the most leverage for volume-based pricing.
- Reassess Tier 2 Contribution: the smallest share at 15.61% ($174M) may point to underused capacity worth exploring.
PO Value by Sourcing Country
Decision Impact:
- Focus on India: the largest sourcing country at $261M, supplier performance here has the biggest impact on the whole network.
- Strengthen Japan and China: together roughly $281M in procurement spend, both deserve dedicated relationship management.
- Monitor Smaller Sourcing Markets: countries like Thailand ($51M) carry less individual risk but are worth reviewing for consolidation opportunities.
Manufacturing Cost by Category
Decision Impact:
- Manage OTC Cost Pressure: the highest manufacturing cost category at $0.28bn, and the first place to look for efficiency gains.
- Optimize Cardiovascular and Pain Management: mid-tier categories ($0.24bn and $0.26bn) worth benchmarking against output volume.
- Monitor Diabetes and Vitamins: the lowest manufacturing cost categories ($0.19bn and $0.21bn). Worth checking whether that’s simply lower volume, or a category being quietly under-invested in.
Supplier Performance by Sourcing Country
- Singapore leads on every dimension: the lowest defect rate (0.49%), shortest lead time (6.60 days), and the highest supplier rating (5.07).
- Malaysia and Philippines lag furthest behind, with the highest defect rates (2.38% and 2.40%), the longest lead times (16.97 and 16.43 days), and the lowest ratings (3.65 and 3.80).
- India is the volume anchor, handling 2.14M units ordered with a mid-range defect rate (1.19%) and a strong rating (4.44).
Decision Impact:
- Replicate Singapore’s Model: its combination of speed, quality, and rating makes it a benchmark for contract terms elsewhere.
- Address Malaysia and Philippines Performance: both lag on speed, quality, and satisfaction; renegotiate terms or diversify sourcing away from them.
- Protect India as the Volume Anchor: with the largest order volume in the network, any disruption here has the largest downstream effect.
Inventory Health: Closing Stock, Safety Stock, and Reorder Points
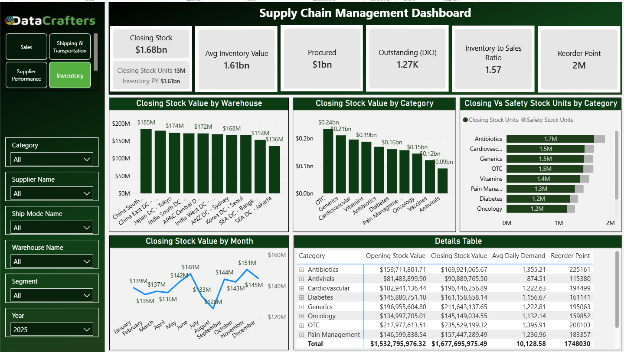
- Closing Stock ($1.68bn, 13M units) – total inventory value at period end, up from Inventory PY ($1.61bn).
- Avg Inventory Value ($1.61bn) – the average holding across the period.
- Outstanding / DIO (1.27K) – as reported, this figure reads far higher than a typical inventory cycle. Before using it in a CCC calculation, it is worth validating the average inventory and cost of goods sold inputs feeding this metric.
- Inventory to Sales Ratio (1.57) – for every dollar of sales, $1.57 sits in inventory.
- Reorder Point (2M) – the aggregate unit threshold that triggers replenishment.
Decision Impact:
- Validate the DIO Calculation: confirm the underlying inputs before this number feeds CCC reporting.
- Monitor the Inventory-to-Sales Ratio: at 1.57, compare against category-level demand to see where the buffer is warranted and where it is not.
- Track Closing Stock Growth: stock grew from $1.61bn to $1.68bn year over year; confirm this growth tracks with sales growth rather than slower turnover.
Closing Stock Value by Warehouse
Decision Impact:
- Focus on China South DC: the largest single warehouse holding at $185M, and the first place to look for excess stock.
- Balance Load Across APAC Warehouses: China East/Tokyo, Japan South, and APAC Central DC each hold between roughly $168M and $174M, a relatively even spread worth maintaining.
- Monitor Smaller Warehouses: facilities in the $136M-$154M range carry less individual risk but should still be reviewed for slow-moving stock.
Closing Stock Value by Category
Decision Impact:
- Manage OTC Inventory Closely: the highest-value category at $0.24bn, small improvements in turnover here have the largest dollar impact.
- Optimize Generics and Cardiovascular: mid-range categories worth benchmarking against demand forecasts.
- Monitor Oncology: it shows the lowest closing value, but unit costs in this category tend to run higher than most, so a smaller dollar figure doesn’t automatically mean a smaller shortage risk.
Closing Stock vs. Safety Stock by Category
Decision Impact:
- Review the Antibiotics Buffer: the largest closing stock position at 1.7M units – confirm the buffer isn’t excessive relative to its safety stock line.
- Maintain Generics, Cardiovascular, and OTC Balance: all three sit close to 1.5M units, roughly proportional to their safety stock lines.
- Watch Oncology and Diabetes: both sit at the smallest closing stock positions (1.2M units each), which leaves less cushion for a demand spike than the other categories have.
Closing Stock Value by Month
Decision Impact:
- Investigate the June Dip: closing stock fell to $126M in June, the lowest point in the year – confirm whether this was a planned drawdown or a stockout risk.
- Plan for the September Peak: stock built up to $151M by September; align procurement timing so this reflects anticipated demand rather than overordering.
- Smooth Month-to-Month Swings: values move between $126M and $151M across the year; tighter demand forecasting could narrow this range.
Inventory Detail by Category
- OTC is the largest category, opening at $217.98M and closing at $235.53M, with the highest average daily demand (1,395.91 units) and reorder point (208,103 units).
- Generics follows closely, opening at $196.96M and closing at $211.64M with average daily demand of 1,222.81 units.
- Across all categories, opening stock of $1,532,795,976.32 grew to a closing value of $1,677,695,975.49, against average daily demand of 10,128.58 units and a combined reorder point of 1,748,030 units.
Decision Impact:
- Prioritize OTC and Generics for Forecast Accuracy: these two categories carry the highest values and daily demand, so small forecasting errors compound quickly.
- Confirm Reorder Points Match Current Lead Times: cross-check the combined 1,748,030-unit reorder point against the supplier lead times covered earlier in this article, since a supplier slowdown changes what an adequate reorder point looks like.
Report Link
Report: SCM Dashboard
Conclusion
This second part of the series zooms in from the company-wide view in Part 1 to two of the four areas that decide how well the supply chain runs day to day: supplier performance and inventory positioning. Each ties back to IAS 2 – supplier lead time factors into how inventory is costed, and reorder points and safety stock determine how much of that inventory sits on the balance sheet at any given time.
A few things stand out enough to act on: renegotiate supplier terms in Malaysia and the Philippines, look at what makes Singapore’s suppliers work so well and see if it can be replicated, and double-check the DIO and reorder point figures before they drive procurement decisions. Together, the Supplier Performance and Inventory views of the Supply Chain Management Dashboard give finance and operations teams a shared, IAS-aligned view of where working capital is tied up and what it will take to free it.