Executive Summary: Supply chain data usually lives across procurement, inventory, production, and logistics systems. This article shows how a Power BI supply chain dashboard brings those inputs together and aligns them with IAS 2 (Inventories) and IAS 16 (Property, Plant, and Equipment), so operational metrics like inventory turnover, near-expiry stock, and on-time delivery tie directly to accurate financial reporting. The result is a single view that supports faster operational decisions and cleaner financial accountability.
INTRODUCTION
The global supply chain is a connected network of suppliers, manufacturers, distributors, retailers, warehouses, and customers. Efficient operations depend on procurement, inventory, production, and logistics working together, so that the right product reaches the right place at the right time. One of the central questions for any finance-aware business is how to keep those operational decisions aligned with financial reporting standards.
Power BI gives teams a strong platform to unify and analyze supply chain data, turning operational inputs from procurement, inventory, production, and logistics into meaningful insight. When that insight is aligned with IAS standards, particularly IAS 2 (Inventories) and IAS 16 (Property, Plant, and Equipment), it supports accurate financial reporting alongside day-to-day operational visibility. This article focuses on designing a Power BI supply chain dashboard that connects operational performance with IAS-compliant financial logic, supporting more informed and accountable decisions.
What is Supply Chain Management?
A well-run supply chain is the invisible backbone behind every product you buy, moving raw materials smoothly all the way to the customer.
Supply chain management (SCM) is the coordination of a business’s entire production flow: sourcing, manufacturing, warehousing, and logistics, everything required to turn raw materials into finished products and deliver them to customers.
Why is Supply Chain Management important?
Supply chain management shapes cost efficiency, customer satisfaction, and overall business performance. It drives profitability and helps businesses build a competitive advantage in the global marketplace. Strong SCM makes sure the right products reach customers at the right time while keeping waste and operational costs low.
Research shows that companies with optimized supply chains can achieve up to 15–20% lower supply chain costs and significantly improve service levels. During the COVID-19 disruption, companies with resilient, well-managed supply chains recovered faster and maintained continuity, which underlined the strategic importance of SCM well beyond daily operations.
Key Components of Supply Chain Management
Supply chain management brings together several moving parts. Procurement covers the sourcing of raw materials, where teams weigh local against global suppliers on cost and sustainability. Manufacturing turns those materials into finished goods through assembly, quality control, and packaging. Logistics and transportation handle shipping, warehousing, and last-mile delivery. Warehousing and inventory management keep an eye on inventory levels, safety stock, and storage costs. Customer service and returns management round out the cycle, covering order delivery along with returns handling and customer compliance.
Strategies for Supply Chain Management:
Companies generally lean on one of three strategies. A stable supply chain plans production and delivery around steady market demand, keeps inventory levels consistent, and focuses on cost efficiency and lower production logistics costs. A reactive supply chain suits uncertain demand: the company stays flexible enough to respond to market shifts quickly and produces mainly once an order comes in. An efficient reactive supply chain blends the two, pairing stability with flexibility to hold cost efficiency while still reacting quickly to demand fluctuations.
The right strategy depends on the product type, market trends, cost structure, and industry requirements.
Two flows tie the whole chain together. Information flow is the movement of data and communication between the different entities in the supply chain, and keeping that flow clear is what ensures smooth coordination between suppliers, manufacturers, distributors, retailers, and customers.
Supply Chain in Manufacturing:
The manufacturing supply chain is an end-to-end system for producing and delivering a product, covering everything from raw materials to finished goods in the customer’s hands. It moves through seven stages.
- Raw Materials Sourcing: Procuring raw materials from suppliers with an eye on quality, cost, and timely availability to meet production needs.
- Inbound Logistics: Transportation, storage, and receipt of raw materials at the manufacturing facility, with efficiency and cost reduction in mind.
- Manufacturing and Production: Transforming raw materials into finished products, optimizing production processes and holding quality steady.
- Warehousing and Inventory Management: Storing and managing finished goods so availability stays high while excess inventory and stockouts stay low.
- Outbound Logistics: Distributing finished products from warehouses to retailers or customers, keeping delivery timely and cost-effective.
- Retail and Customer Fulfillment: Selling through retail channels and fulfilling orders efficiently, supporting customer satisfaction and on-time delivery.
- Reverse Logistics (Returns and Recycling): Managing returns, including defects, recycling, and refurbishing, to recover value and reduce waste.
Supply Chain in Service:
A service supply chain manages intangible goods, centering on people, information, and processes rather than raw materials. It delivers services to customers efficiently by managing workflows, technology, and resources.
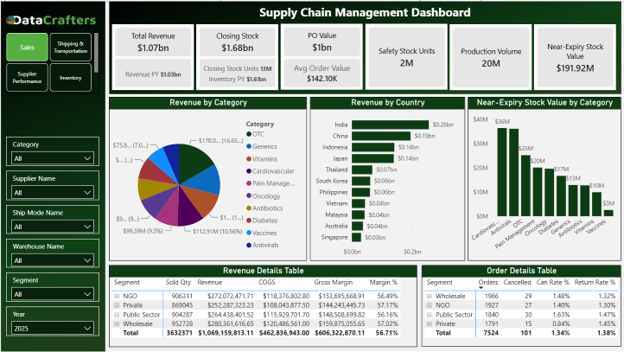
Insight and decision making KPIs:
All KPIs based on FY 2025


Decision Impact:
- Optimize Inventory: Reduce near-expiry stock and manage high closing stock through better demand forecasting and inventory rotation.
- Monitor Procurement and Production: Keep PO planning aligned with actual demand to balance stock levels and production.
- Maintain Safety Stock: Hold enough safety stock to keep fulfillment smooth while balancing storage costs.
- Improve Transportation Efficiency: Look at strategies to shorten average transit days and lower returns, which lifts customer satisfaction.
- Focus on Shipment Accuracy: Sustain high on-time delivery to protect service levels and keep returns low.
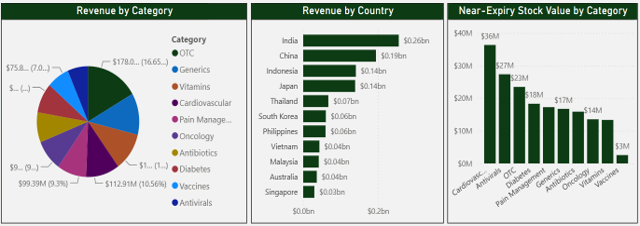
Decision Impact Revenue by Category:
- Focus on Generics and OTC: The top performers, where effort should go toward holding and expanding market share.
- Leverage Vitamin and Oncology Growth: Strong revenue potential in these segments makes them a priority for further market penetration.
- Optimize Cardiovascular and Pain Management: Stable categories worth tuning for efficiency and keeping aligned with market trends.
- Monitor Antivirals and Vaccines: Smaller in contribution today, with room to grow by meeting market demand, particularly during health crises.
Decision Impact Revenue by Country:
- Focus on India and China: The largest revenue generators, and the priority for strategic growth and expansion.
- Strengthen Presence in Japan and Indonesia: Significant markets that show potential for further growth.
- Optimize Operations in Southeast Asia: The Philippines, Thailand, and Vietnam show steady revenue, which makes it worth strengthening the existing presence.
- Monitor Smaller Markets: Australia and Singapore contribute less today, and targeted campaigns could open room to grow revenue in these regions.
Decision Impact Near-Expiry Stock Value by Category:
- Move High Near-Expiry Stock First: Prioritize the sale or redistribution of Cardiovascular, Antivirals, and OTC stock to protect margin.
- Tune Procurement and Production: Adjust planning to keep inventory lean in categories with recurring near-expiry patterns.
- Rotate Mid-Level Categories: Monitor and rotate Diabetes, Pain Management, Generics, Antibiotics, Oncology, and Vitamins to keep stock fresh.
- Vaccines: Low risk here, so standard inventory monitoring is enough.

Decision Impact Revenue Details Table:
- Focus on Private and Wholesale Segments: These segments carry the highest profit margins, which supports keeping or growing their performance.
- Optimize NGO and Public Sector Segments: The NGO segment runs the lowest margin while still bringing in considerable revenue, so cost optimization is where profitability can improve.
- Increase Profitability: Managing cost of goods sold (COGS) more closely can lift gross margins across all segments, and the NGO segment has the most room.
Decision Impact Orders Details Table:
- Reduce Cancellations: The Private segment shows the highest cancellation rate, which better order management and customer engagement can bring down.
- Improve Return Management: The Wholesale segment has the highest return rate, which points to an opportunity in quality control and customer satisfaction.
- Sustain NGO and Public Sector Performance: These segments run lower cancellation rates, worth holding through efficient order fulfillment.
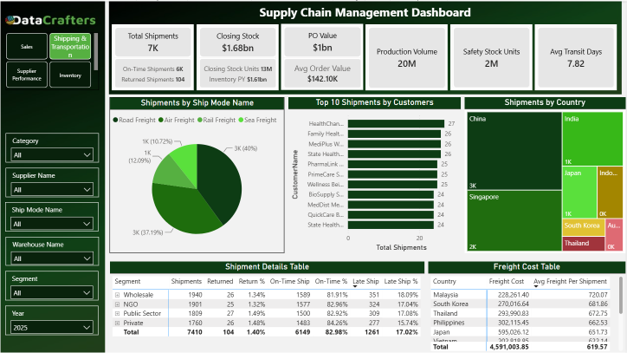
Shipping & Transportation Overview
- Total Shipments (7K): Most shipments arrive on time (6K), with 104 returned, reflecting strong fulfillment performance.
- Closing Stock ($1.68B / 13M units): Inventory is sufficient to support shipping and demand.
- Total PO Value ($1.15B / Avg Order $142.1K): Procurement aligns with production and shipping needs.
- Production Volume (20M units): Manufacturing output supports shipment requirements.
- Safety Stock Units (2M): Provides a buffer for unexpected demand.
- Average Transit Days (7.82): A read on shipping efficiency and delivery timelines.
Shipments by Mode
Road Freight (40%) and Air Freight (37%) dominate, with Rail and Sea contributing smaller shares. Reading mode efficiency helps optimize delivery cost and speed.
Top 10 Customers
Customers like HealthChain, Family Health, and MediPlus W receive the highest shipment volumes, which marks them as priority accounts for operational focus.
Shipments by Country
China (3K), Singapore (2K), and India (1K) lead in shipments, which marks them as key markets for logistics planning. Smaller volumes elsewhere point to areas with room to grow.
Freight Costs
Total freight cost is $4.59M, with an average of $619.57 per shipment. Japan and Malaysia carry higher costs, which points to clear optimization opportunities.
Segment Performance
- Wholesale and NGO segments post high on-time rates (~82–83%), with low return percentages (~1.3–1.4%).
- Late shipments sit at ~17% overall, which highlights where efficiency gains are available.
Decision Impact
- Optimize Transportation Modes: Favor cost-effective, faster modes to bring down transit time and freight costs.
- Prioritize Key Customers and Markets: Keep shipments timely for high-volume customers (HealthChain, Family Health) and key countries (China, Singapore, India).
- Reduce Late Shipments: Find bottlenecks in segments with higher late-shipment rates to lift overall on-time performance.
- Control Freight Costs: Target high-cost regions (Japan, Malaysia) with optimized shipping strategies.
- Maintain Safety Stock: Keep inventory sufficient for smooth fulfillment through high-demand periods.
Conclusion
This first part walked through the key metrics behind revenue, inventory, production volume, and order fulfillment, and showed where the operation is strong and where it has room to grow. It surfaced the top-performing categories and regions, along with clear opportunities in near-expiry stock and cancellation rates.
Part two looks closer at supplier performance and inventory management strategies, and how tuning them can streamline operations, lower costs, and lift overall supply chain performance. More practical insights follow in the next installment.
If you are working to connect supply chain operations with cleaner financial reporting, Data Crafters builds this in Power BI. Let’s talk about what it looks like for yours.