
In Power BI, a stunning dashboard is worthless if the numbers behind it don’t add up. What truly builds trust in reports isn’t the visuals — it’s the semantic model that powers them.
Every Power BI report is powered by a semantic model. It’s the layer that shapes raw data into meaningful insights, defines the relationships between tables, and standardizes the measures that drive KPIs. If the model is weak or inconsistent, no amount of design can save the dashboard. But when it’s strong, every report built on top of it gains reliability, scalability, and the confidence of its audience.
Why Power BI Architecture Matters: Thick vs Thin Models
Even in a single PBIX, Power BI separates the dataset (the model) and the report once it’s published. For small self-service projects, that separation is convenient because developers can update queries, measures, or visuals all in one file. But at scale — when multiple reports depend on the same dataset, or when modeling and reporting are handled by different teams — this architectural distinction becomes critical.
That’s why it’s important not to treat thick and thin as opposing choices. Instead, think of them as complementary: the thick model defines the dataset, while thin reports extend their reach, ensuring consistency while giving teams the flexibility to tell their own data stories.
What is a Thick Model?
A thick model is a self-contained PBIX file where everything lives inside one place. Beyond holding the data model, measures, and visuals, thick models also give developers full control — from shaping queries in Power Query, to managing relationships, to writing DAX directly in the same file. This makes them fast to set up and flexible for experimentation.
- Contains the data model (tables, relationships, queries)
- Holds all the DAX measures and calculations
- Includes the report visuals within the same file
- Published as both a dataset and a report in the Power BI Service
- Common starting point for self-service and small projects
What is a Thin report?
A thin model is a lightweight PBIX file that contains only the report layer — the visuals, layouts, and interactions — while connecting to a dataset published in the Power BI Service. Instead of managing its own data model, it leverages a shared one, making it easier to keep business logic consistent across multiple reports.
- Contains only the report visuals and formatting
- Connects to a published dataset for data and measures
- Ideal for team-based development, where data modeling and reporting are handled separately
- Ensures consistency by reusing the same measures and KPIs across reports
- Keeps report files small and easy to maintain
When to Use Thick vs Thin Reports in Power BI
Thick models in Power BI are best for quick experiments, prototypes, or personal workspaces where governance isn’t the priority. Thin reports shine in enterprise environments, where consistency, scalability, and standardized KPIs are essential across departments.
Most organizations adopt a hybrid approach: build and certify one or more central thick datasets and let thin reports flourish on top of them. This way, governance and agility work hand in hand.
Real-World Example: HR Analytics with Thick and Thin Models
An HR analyst builds a PBIX file combining employee records, payroll data, and attendance. The file includes queries, measures, and visuals — a thick model that works well for HR’s immediate needs, like tracking headcount and salary costs.
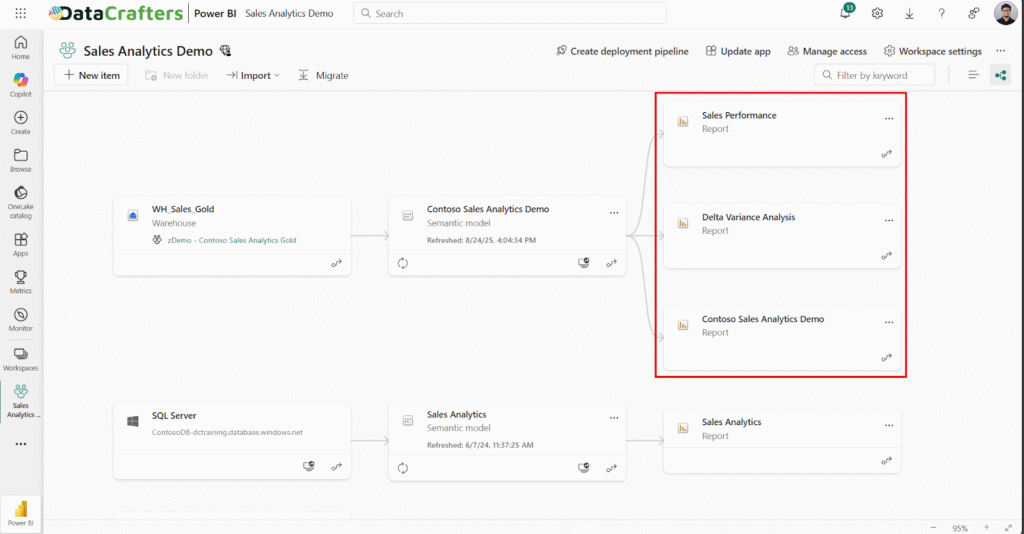
As the company grows, other teams also need insights from the same data. Instead of recreating everything, the BI team publishes the file as a Workforce Dataset. From there:
- HR builds a Headcount & Attrition Report
- Finance creates a Payroll & Benefits Cost Report
- Operations develops a Shift & Overtime Report
Each report is a thin model: lightweight, flexible, and tailored to its audience, but all powered by the same consistent dataset.
Thick vs Thin Power BI Models: Key Differences at a Glance
| Aspect | Thick Model | Thin Report |
| Content | Data model, DAX measures, and visuals all in one PBIX | Only visuals and layouts; relies on a published dataset |
| Reusability | Limited — logic is locked in each file | High — same dataset can power many reports |
| Governance | Harder to enforce; risk of KPI duplication | Easier — single dataset becomes the source of truth |
| File Size | Larger, can grow heavy | Very small, lightweight |
| Performance | Slower refresh as files scale | Faster to open; performance depends on dataset |
| Maintenance | Updates must be applied to each file separately | Update the dataset once, changes flow to all reports |
| Ownership | Usually handled by one developer or team | Can be split — BI team manages dataset, others build reports |
| Collaboration | Harder — every team manages its own PBIX | Easier — multiple teams can share the same dataset |
| Best For | Prototypes, ad-hoc analysis, small projects | Enterprise rollout, standardized KPIs, cross-team reporting |
Best Practices and Common Pitfalls in Power BI Architecture
The most effective strategy is to centralize business logic in a thick dataset and encourage teams to build thin reports on top of it. Certify important datasets so users know which version to trust, and document KPIs so they’re transparent to everyone.
Avoid common pitfalls such as:
- Duplicating measures across multiple thick files
- Overloading datasets with unnecessary columns
- Allowing “dataset sprawl” with too many uncertified datasets
Performance and Maintenance: Thick vs Thin Reports
Performance and maintenance clearly differentiate thick and thin Power BI models. Thick models tend to grow large and refresh slowly, while thin reports remain lightweight and benefit from centralized datasets.
Maintenance also tilts in favor of thin reports. Update a measure once in the dataset, and the change flows automatically to every connected report. With thick models, every PBIX must be updated separately — a recipe for inconsistency.
Future-Proofing with Fabric and Beyond
The future of Power BI is increasingly shaped by Microsoft Fabric, and this makes the relationship between thick and thin models more important than ever. In Fabric, centralized semantic models are built directly on top of Lakehouses or Warehouses, serving as trusted, reusable datasets for the entire organization. These act as enterprise-level thick models, containing transformations, relationships, and business logic in one place.
Once published, these models become the foundation for thin reports. Because thin reports only connect to the dataset, they allow many different business units to build tailored reporting experiences without duplicating calculations or measures.
How this architecture works in Fabric:
- Step 1: Data is stored and managed in a Fabric Lakehouse or Warehouse.
- Step 2: A semantic model (thick model) is built on top, defining relationships, measures, and KPIs.
- Step 3: The model is published and certified as a single source of truth.
- Step 4: Multiple thin reports connect to the model, enabling Finance, Marketing, Operations, and other teams to create insights without rebuilding the logic.
This setup brings several advantages:
- Scalability – datasets can handle millions or even billions of rows.
- Consistency – all teams use the same definitions for KPIs and metrics.
- Agility – thin reports stay lightweight, allowing departments to customize visuals quickly.
- Governance – updates to the dataset flow automatically to every connected report.
In this way, Fabric naturally enforces the idea of “build thick once, scale thin everywhere.” Thick models serve as the foundation of trust, while thin reports deliver flexibility and reach across the business.
(Insert Visual: Fabric Lakehouse/Warehouse → Certified Semantic Model (thick) → Multiple Thin Reports for departments)
How to Create Thin Reports: Desktop vs Service
Thin reports can be built in more than one way. Power BI offers two main approaches: through the Desktop app or directly in the Service. Both work, but Desktop provides more flexibility and advanced features.
1. Step-by-Step: Creating Thin Reports in Power BI Desktop
Power BI Desktop is the preferred tool because it gives developers full flexibility. You can connect live to a published dataset, build visuals, and then publish the report back to the Service. Unlike the Service, Desktop still allows access to the model view and supports features such as composite models and report-level measures.
Quick steps:
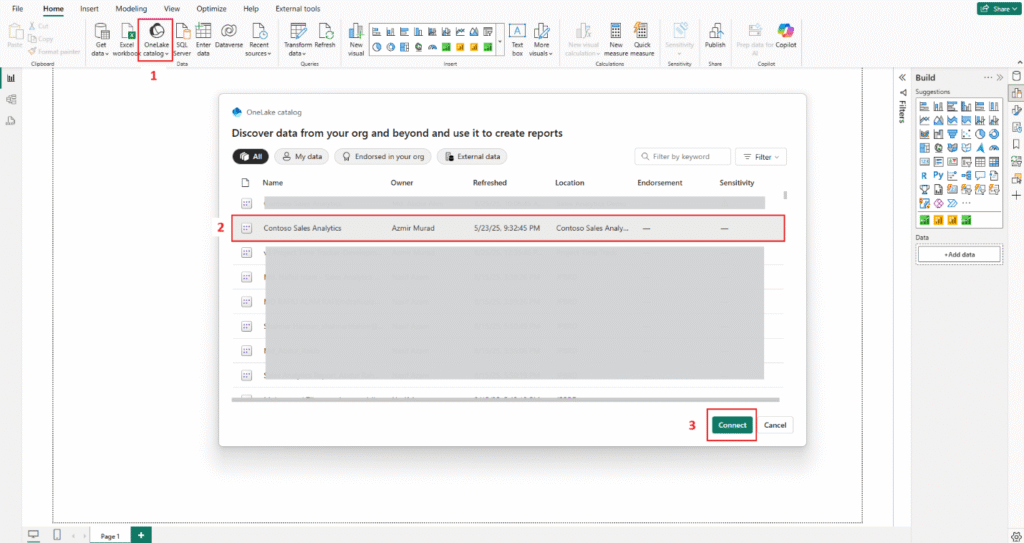
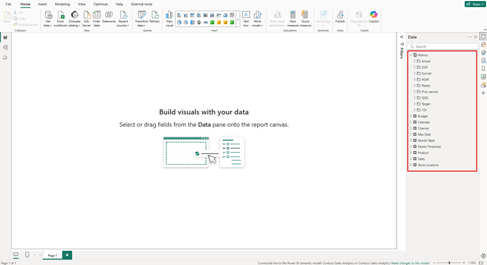
- Open Power BI Desktop → Home → OneLake Catalog → Power BI semantic models.
- Select the published dataset you want to connect to
- Build the report as usual, then publish to the Service
2. Step-by-Step: Creating Thin Reports in Power BI Service
Reports can also be built directly in the Service. This method is fast and convenient, though more limited — you can’t see the underlying data model, and functionality is lighter compared to Desktop.
Quick steps:
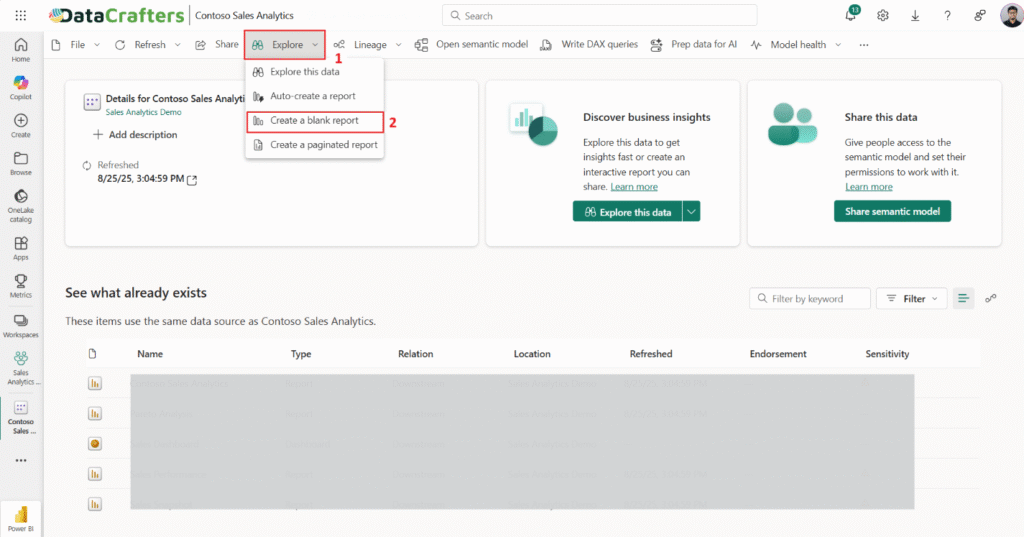
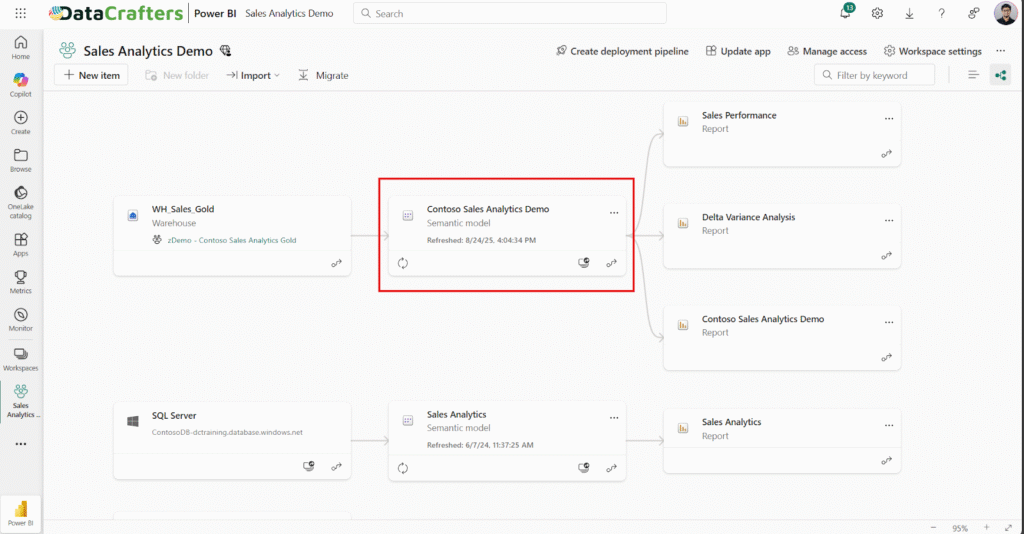
- In your workspace, open the semantic model you want to connect,
- Click on Explore and choose Create a blank report.
- Select the dataset and click Create
- Build your report and save it in the workspace
How to Download a Thin Report in Power BI
The Service also offers a way to split a thin report from a published full report. This is useful if you want to separate the dataset and visuals after publishing
Quick steps:
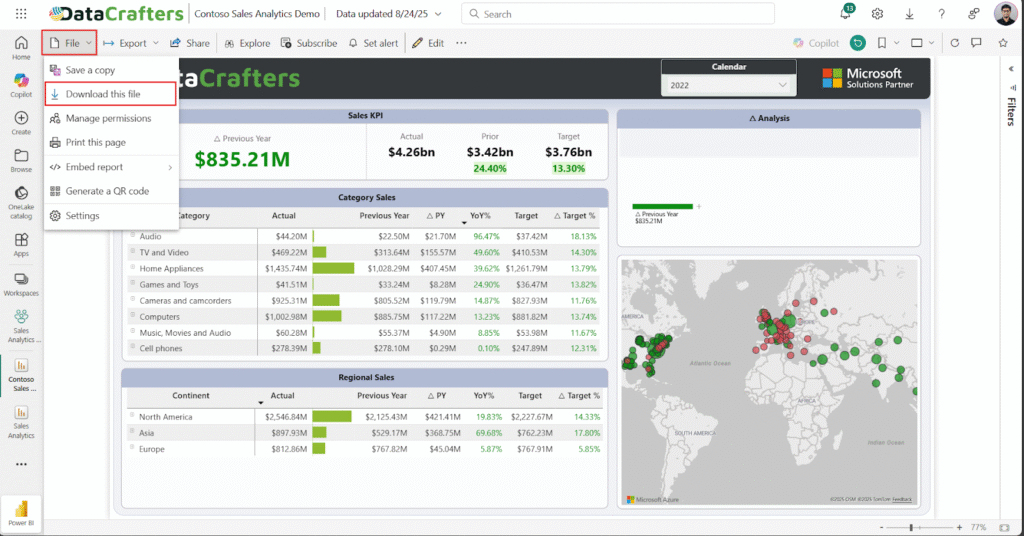
- Open the report in a workspace
- Go to File → Download this file
- Choose A copy of your report with a live connection to data online (.pbix)
- Download the thin PBIX file
Conclusion: One Dataset, Many Reports in Power BI
The future of Power BI architecture is hybrid: build thick datasets once, certify them, and let thin reports scale across the business. This approach enforces governance, ensures consistent KPIs, and empowers every team with trusted insights.
In other words, Power BI works best when you think: one dataset, many reports. By designing with this principle in mind, your reporting environment becomes scalable, governed, and ready for the future.


