

Introduction: The Changing Face of Analytics
There was a time when building data pipelines, preparing analytics-ready datasets, and deploying dashboards required deep knowledge of SQL, scripting, or even cloud engineering. But today, thanks to platforms like Power BI and Microsoft Fabric, we’re witnessing the rise of a new professional: the no-code analytics engineer.
This role empowers Power BI developers and Excel users alike to go beyond report creation. Now they can manage data ingestion, transformation, automation, and delivery without needing to write code.
In this blog, we explore how you can evolve your Power BI skills into full-scale analytics engineering using Microsoft Fabric.
Why This Shift Matters
Power BI revolutionized business intelligence by putting powerful analytics into the hands of analysts and business users. However, it still had limits:
- You couldn’t build scalable data infrastructure.
- You couldn’t orchestrate workflows easily.
- You couldn’t store or serve large, live datasets with full control.
These limitations led to dependency on IT teams or advanced developers until Microsoft Fabric changed the game.
Fabric adds all the layers missing from Power BI: ingestion, transformation, orchestration, and enterprise-ready storage. Most importantly, it retains Power BI’s user-friendly interface, meaning you don’t need to be a developer to use it.
The Rise of the No-Code Analytics Engineer
With Fabric, a typical Power BI developer gains the tools and environment to transform into something more powerful.
What stays the same:
- Data modeling using Power BI
- Visual storytelling through reports
- Familiar Power Query experience
What’s now possible:
- Creating Lakehouses and Warehouses
- Automating pipelines and orchestration
- Enabling real-time analytics with Direct Lake
- Sharing trusted data via SQL and Excel
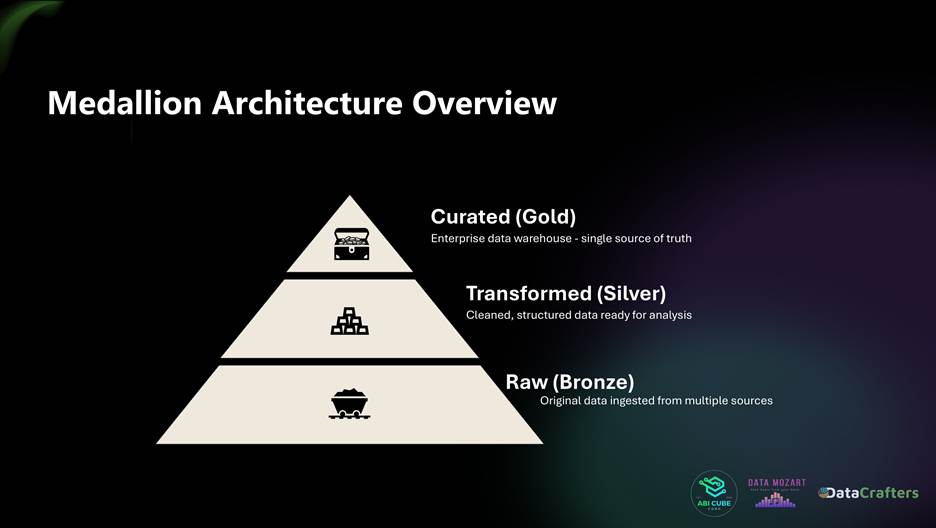
Understanding the Medallion Architecture
To structure your data well, Fabric promotes a three-layer design model:
- Raw (Bronze Layer): Raw ingested data, untouched
- Transformed (Silver Layer): Cleaned, validated data
- Curated (Gold Layer): Business-ready data models and summaries
This structure improves collaboration, trust, and reusability.
Key Fabric Concepts Explained Visually
1. Task flow
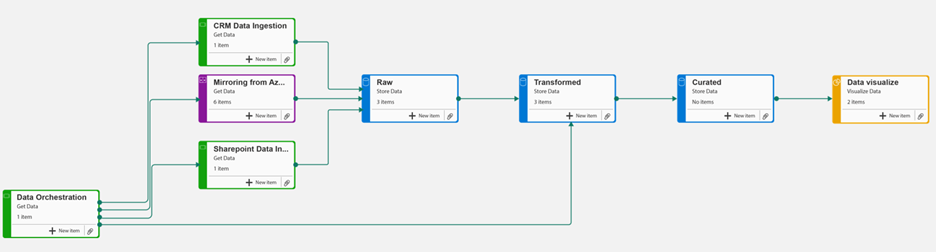
Task flow is a workspace visualization feature that lets you create a visual map of how your data projects flow from start to finish. It helps you organize and connect different Fabric items like notebooks, datasets, and reports into logical tasks, making it easier to understand relationships and navigate complex workspaces. Think of it as a visual blueprint for your data solution that keeps your team aligned on project structure and dependencies.
2. Creating Lakehouses
3. Data Ingestion
Data ingestion in Microsoft Fabric is the process of bringing data from external sources into OneLake, the unified data lake at the core of Fabric. It serves as the first step in the data engineering and analytics workflow, enabling downstream processes like transformation, modeling, and visualization.
Some of the demos are shown below,
A. Getting Data from ADLS Gen 2
B. Getting Data from Sharepoint Excel files
C. Data Mirroring Capabilities
4. Moving from Raw Lakehouse to Transformed Lakehouse
Moving from Raw Lakehouse to Transformed Lakehouse creates a clean, structured, and optimized data layer built on Delta tables with consistent schema and partitions.
This transition enables faster, more reliable insights, promotes reusable datasets, ensures data governance, and enhances query performance.
5. Enterprise Data Warehouse Creation
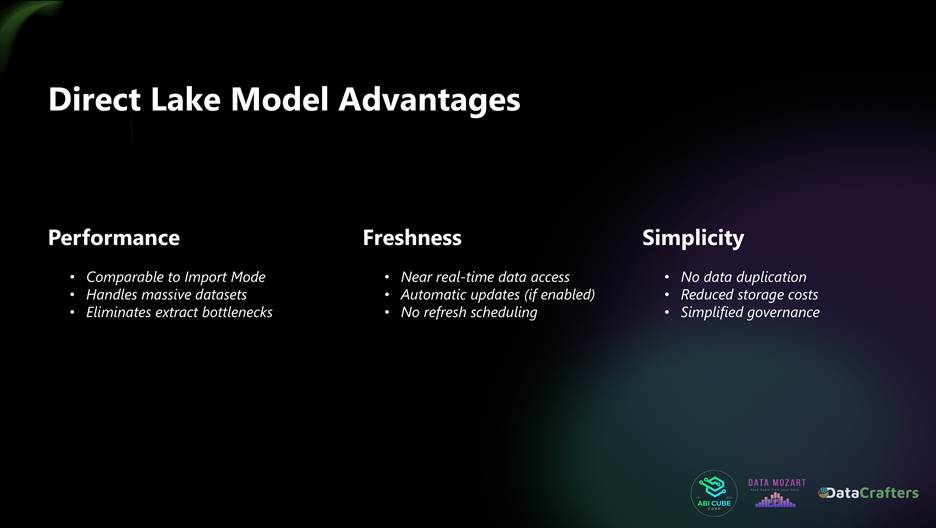
6. Direct Model in Microsoft Fabric
Traditional Power BI models operate in Import or DirectQuery modes. Each has drawbacks:
- Import = fast, but stale
- DirectQuery = fresh, but slow
Direct Lake Mode offers the best of both:
- Near real-time access
- No duplication of data
- High performance without refresh bottlenecks
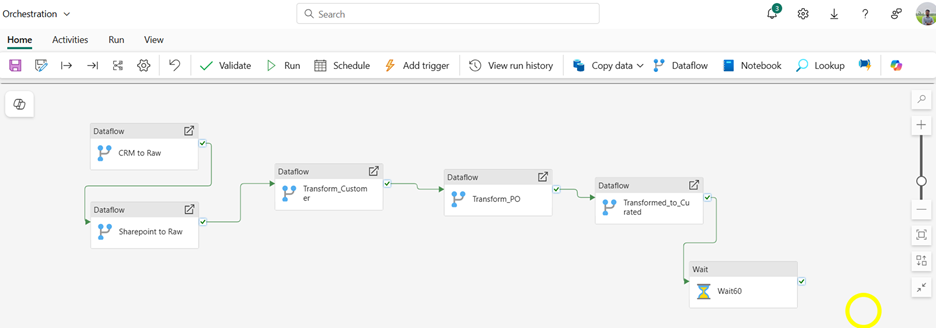
7. Orchestration
In the past, orchestrating data workflows meant manually managing refresh sequences and dependencies, a process that was both time-consuming and error-prone. Microsoft Fabric transforms this with automated orchestration using Pipelines.
These visual tools allow users to:
- Automate multi-step data processes
- Refresh dataflows and datasets in the correct sequence
- Trigger actions based on success or failure
- Eliminate manual refresh chains
Previously found in Azure Data Factory, these capabilities are now built into Fabric in a more accessible, no-code format. For analytics engineers, this means managing enterprise-grade data workflows without scripting, increasing both reliability and efficiency.
No Code SQL and Excel Integration:
1. Visual Queries
Fabric introduces Visual SQL Queries, where you can drag-and-drop to shape queries. No writing is required. Fabric writes SQL behind the scenes, and you can save your logic as SQL views.
2. Save as View
Following the visual query showcase, now we can just save the outputs as a SQL View.
3. Excel Integration from SQL Queries
These views can then be accessed directly from Excel, creating a live data experience.
Putting It All Together: The End-to-End Flow
Your journey from raw data to actionable insight is now entirely visual, automated, and integrated all within a single platform. With Microsoft Fabric, you can ingest data from a variety of sources, transform it using intuitive Dataflows, store it securely in a Lakehouse or Warehouse, model it efficiently with Direct Lake, and share insights seamlessly through Power BI, Excel, or SQL.
It’s a streamlined, end-to-end workflow that empowers no-code analytics engineers to deliver enterprise-grade analytics without writing a single line of code.
Business Value: What This Means for Teams
Adopting Fabric doesn’t just help analysts, it helps the business.
- Shorter time to insight
- Cleaner, more trustworthy data
- Fewer dependencies on IT
- Real-time reporting at scale
- Collaborative, governed environments
It brings both technical efficiency and organizational agility.
Conclusion: You’re Closer Than You Think
If you’re already building dashboards, writing DAX, or shaping data with Power Query, you’re most of the way there. Becoming a no-code analytics engineer is about extending those same habits into the broader data lifecycle.
Microsoft Fabric gives you the tools.
Power BI gives you the foundation.
All you need now is curiosity and practice.


