
Microsoft Fabric gives organizations two distinct workloads for two distinct kinds of work. Power BI handles the analytical view: dashboards, KPI tracking, and the reports that tell you what’s already happened. Plan handles the planning view: budgets, forecasts, targets, and scenarios, built directly on top of the same semantic models and governed data that Power BI already reads.
Neither replaces the other. They’re designed to run side by side on the same Fabric foundation, within Fabric IQ (Microsoft’s decision intelligence layer), so a forecast entered in Plan is immediately visible alongside Power BI actuals, and a data model update flows through both without a manual sync or a separate reconciliation step.
Inside Fabric IQ, Microsoft and Lumel (the company behind Inforiver Analytics+, the most-installed Power BI custom visual on AppSource) built Plan together as a new Fabric workload. Plan isn’t a single canvas. It ships four, each with a distinct job:
- Planning Sheet: a spreadsheet-like surface for budgets, forecasts, and what-if scenarios
- PowerTable Sheet: structured planning at scale, aligned to dimensional Fabric models
- Intelligence Sheet: the no-code reporting and visualization canvas (over 100 charts in the box)
- InfoBridge: the data integration layer that keeps the other three in sync with source data
The reporting canvas within Plan is the third one: the Intelligence Sheet. It’s where charts get drawn, financial reports get formatted, and dashboards get assembled, directly on top of planning data, first-party in Fabric, no marketplace install required.
This is Part 1 of the Intelligence Sheet introduction: where it sits within Plan, what it brings to the planning workflow, and how to get access. Part 2 walks through the canvas itself: the visual library, financial reporting tools, and everything inside.
Where the Intelligence Sheet sits
The names overlap quickly: Fabric, Fabric IQ, Plan, Intelligence Sheet, Planning Sheet. They’re nested, and untangling them up front saves a lot of confusion later.
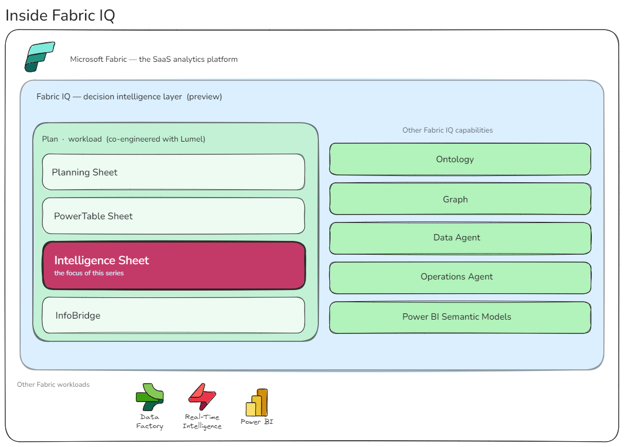
[Inside Fabric IQ]
Fabric IQ launched as a preview in November 2025. Here’s what it contains.
Six items live in Fabric IQ, each with a distinct job:
| Item | What it does |
| Ontology | Defines the business vocabulary: entities, properties, relationships, and condition-action rules that downstream tools share |
| Graph | Native graph storage and compute for relationship analysis, dependency tracing, and pattern matching over connected data |
| Data Agent | Conversational Q&A AI over governed enterprise data; uses ontologies to understand business concepts |
| Operations Agent | AI agent that monitors real-time signals, applies ontology rules, and recommends or triggers governed actions |
| Power BI Semantic Models | Curated analytical models (KPIs, measures, hierarchies), also part of the Power BI workload |
| Plan | The EPM workload, built in partnership with Lumel, that hosts the Intelligence Sheet and three sibling canvases |
The Intelligence Sheet doesn’t operate in isolation. It reads from semantic models, respects the ontology, gets queried by Data Agents, and feeds Operations Agents. Everything that makes it more than a chart canvas (writeback, plan-versus-actuals analytics, AI grounding) is enabled by an item sitting next to it inside the same workload. That’s why “first-party in Fabric IQ” reads differently than “first-party in Power BI” would have.
Plan is a broad workload: enterprise planning, budgeting, forecasting, scenario modelling. Three of its four canvases handle that work; one, the Intelligence Sheet, is the visualization layer. Here’s how Lumel frame it.
The Lumel view: three pillars on Fabric
The three-pillar model that emerged from the Microsoft-Lumel partnership makes the division of responsibility explicit. Microsoft provides the foundation: Fabric IQ’s Ontology, Power BI Semantic Models, Fabric SQL, and OneLake, the governed, shared infrastructure that everything above it depends on. Lumel delivers the capability layer on top:
- Enterprise Planning: the prescriptive pillar. This is where organisations define what should happen: budgets, forecasts, scenario models, and version-controlled targets. Plans are entered directly on top of Fabric semantic models, no export-to-Excel, no reconciliation step, with writeback and approval workflows built in.
- Intelligence: the descriptive pillar. This is where organisations understand what is happening: reports, variance analysis, dashboards, and management storyboards. The Intelligence Sheet is the canvas that delivers this, reading simultaneously from semantic models, planning worksheets, and reference data to produce reports that are always current.
- Data Management: the actionable pillar. This is where organisations govern what should be done: master data, reference tables, approval flows, and writeback-enabled data apps. Rather than maintaining lookup tables in Excel or a separate MDM tool, Data Management apps live on Fabric and feed directly into both planning models and intelligence reports.
Microsoft’s semantic foundation gives Lumel’s pillars governed, consistent data to operate against. Lumel’s pillars give Microsoft’s platform the forward-looking capability layer it was missing, a place where plans, reports, and reference data don’t just read from Fabric but actively write back to it. That’s the integration argument in practice, and a consequence of both parties building on the same foundation.
The stack everyone was working around
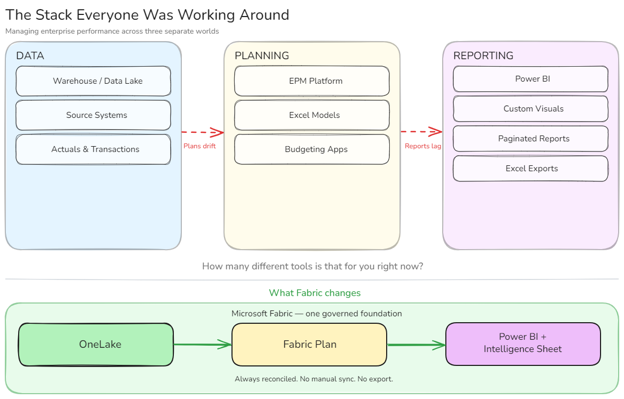
For most organisations, managing enterprise performance means operating across three separate worlds.
Data lives in a warehouse, lake, or source system. Planning happens in a separate tool: a dedicated EPM platform, a budgeting application, or more commonly, a collection of Excel models. Reporting happens in Power BI, pulling from the data platform but rarely connected to the plan.
[The stack everyone was working around]
Each world runs on its own tooling, its own governance, and its own update cycle. When actuals change, someone manually updates the plan. When the plan changes, someone manually refreshes the report. By the time a decision gets made, it’s often based on numbers that have already drifted.
The reporting side carries its own fragmentation on top of that. Most enterprise reporting on Power BI doesn’t actually happen only on Power BI. It happens across native visuals, AppSource custom visuals, Paginated Reports, Deneb specs, and Excel exports, each filling a gap the others don’t cover. A finance team’s P&L might touch four of those in a single reporting cycle: the matrix for the numbers, Inforiver for IBCS variance bars, Paginated Reports for the A4 executive print, and Excel when someone needs an ad-hoc cut the dashboard wasn’t built for.
None of it is wrong. But it accumulates: licensing spread across vendors, governance across multiple approval cycles, skills that don’t transfer between tools.
What Fabric does is bring all three worlds onto one platform. Data in OneLake. Planning in Fabric Plan. Reporting in Power BI and the Intelligence Sheet. One governed foundation, so an update in any layer propagates through the others without an export, a sync, or a reconciliation step.
That’s what Microsoft set out to build: not an extension of any one tool, but a unified platform where data, planning, and reporting share the same foundation. The depth that Inforiver users had been paying for as a custom visual moved inside Fabric as a first-party workload, governed under the same capacity, semantic model, and Purview policies as the rest of the platform.
“Our shared vision with Microsoft is to democratize planning for every organization that has invested in Power BI semantic models.”
Gopal Krishnamurthy, Founder & CEO, Lumel
Getting onto the canvas
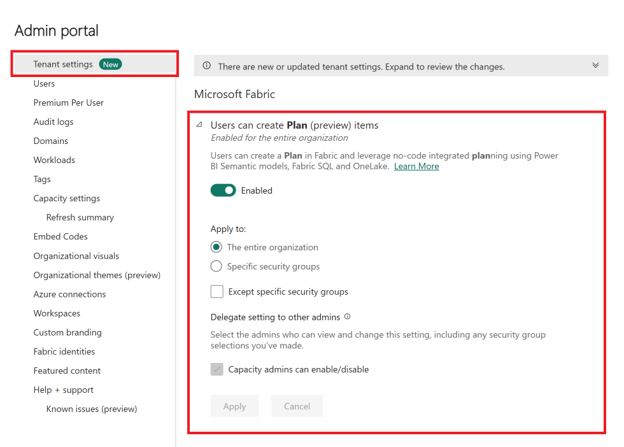
Plan sits on any Fabric capacity. If your organization is already running Fabric, there’s nothing new to procure, no separate license, no additional SKU. The only step between your team and a Plan item is a single tenant setting a Fabric administrator enables in the Admin Portal:
Users can create Plan (preview) items
[Tenant Level Plan Settings]
Once that’s on, Plan appears as a first-class item across every Fabric workspace the capacity covers. From there, select New item in any workspace, choose Plan, and the four canvases (Planning Sheet, PowerTable Sheet, Intelligence Sheet, and InfoBridge) are immediately available.
If your organization isn’t on Fabric yet, Microsoft offers a 60-day trial, enough runway to evaluate Plan on real data before committing. Billing runs on Fabric capacity meters rather than per-user seats, and during the current public preview those meters are tracked but not yet charged. Plan is available worldwide following its launch at FabCon Atlanta in March 2026.
Who this is for
The Intelligence Sheet is designed for the people who build and consume reports every day, not exclusively BI developers.
Finance teams get variance analysis, P&L statements, IBCS management reports, and board-ready paginated output. BI developers using Inforiver, xViz, or other AppSource visuals get a familiar chart library with better governance and no marketplace approval cycle. Business analysts get self-service exploration on governed data without IT dependency. Organizations running fragmented reporting stacks (dashboards, Paginated Reports, custom visuals, Excel) have a consolidation path.
A few things to know before you build
The preview is fully functional, but a few constraints are worth knowing upfront. Guest access isn’t supported yet; Plan items are currently limited to internal tenant users. Workspaces with private links enabled aren’t supported in the current preview. Connecting to a semantic model requires Admin or Build permission, and Direct Lake models need some additional configuration. These are documented preview limitations, not permanent constraints. The core canvas is ready for internal use today.
What’s inside the canvas
Part 1 ends here. Part 2 walks through the Intelligence Sheet canvas itself: the visual library with 100+ charts, financial reporting tools, the three-source data architecture, and collaboration features. If you’re evaluating whether the Intelligence Sheet fits your reporting workflow, Part 2 is where the detail lives.
Resources
- Plan in Microsoft Fabric IQ: Microsoft Learn: official documentation, getting started guides, and billing meter details
- Lumel Intelligence: the Lumel product page and three-pillar architecture overview
- Start a 60-day Microsoft Fabric trial: evaluate Plan in a live Fabric environment at no cost
- FabCon Atlanta 2026: Planning in Fabric IQ announcement: the original announcement blog post


