In today’s fast-paced financial markets, making timely and informed decisions is critical. While traditional analysis focuses on historical performance, modern analytics aims to answer a more important question: what is likely to happen next?
To address this, I developed Finance AI, a data-driven stock analysis solution built using Microsoft Fabric, Power BI, and machine learning. The platform leverages data from Yahoo Finance, focusing on the top 15 actively traded stocks, to create a unified system that not only analyzes historical trends but also provides forward-looking insights in a simple and interactive way.
What This Project Solves
Stock analysis typically requires pulling data from multiple sources, manually consolidating it, and waiting until month-end to see trends. By that time, the opportunity has moved.
Finance AI changes this. The platform combines data engineering, analytics, and machine learning into a single Microsoft Fabric environment. Data ingestion is automated. Forecasts update daily. Everything runs from one dashboard.
What This Delivers
For finance teams managing investment portfolios or tracking market performance, this platform provides:
- Access stock data from a unified source
- Automate data ingestion and transformation
- Analyze historical trends through interactive visuals
- Generate forecasts based on historical patterns
- Compare actual vs predicted performance
- Explore insights dynamically using filters and dashboards
Architecture & Data Pipeline
The platform runs entirely on Microsoft Fabric. One workspace handles data ingestion, transformation, modeling, and visualization. No separate ETL tools. No external database. Everything stays within Fabric.
The solution is built within a Microsoft Fabric workspace, with a Lakehouse serving as the central data repository.
The architecture diagram below illustrates the end-to-end data flow of the solution.
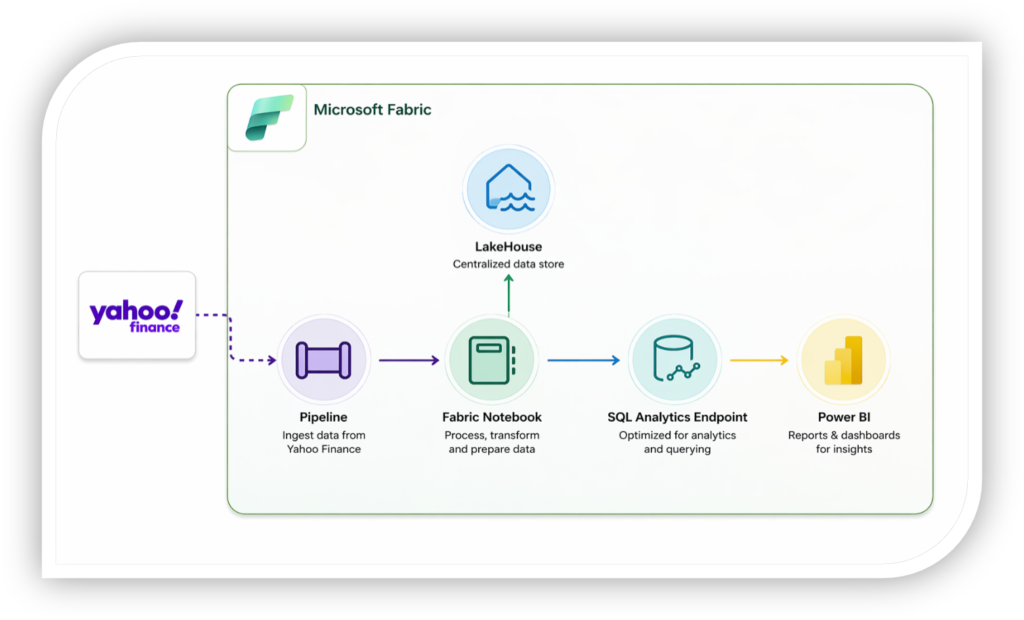
Data Flow Overview
- Stock data is collected using the yfinance (Yahoo Finance API)
- Fabric Notebooks perform data cleaning and transformation
- A RandomForestRegressor model generates price predictions
- Processed data is stored in the Lakehouse
- SQL Analytics Endpoint enables querying and modeling
- Power BI connects to deliver interactive dashboards
This architecture ensures a scalable, modular, and automated analytics pipeline.
Dashboard Overview
The Power BI dashboard provides a comprehensive and interactive view of stock performance. Users can instantly see key metrics such as the latest closing price, predicted closing price, and prediction gap, along with 1-year high and low values for context.
The dashboard also visualizes:
- Historical vs predicted trends
- 200-day moving average (MA 200)
- Trading volume patterns
- OHLC (Open, High, Low, Close) behavior
The dashboard provides flexible interactive filters that allow users to explore data across different time dimensions, including year, month, and quarter. In addition, users can easily switch between different stock tickers to analyze specific companies in detail. To make analysis more intuitive, the dashboard includes quick selection options for top 15 actively traded stocks, enabling users to seamlessly compare performance and trends.
Forecasting Using Historical Trends
A key strength of Finance AI is its ability to generate forecasts using historical stock data. The machine learning model identifies patterns in past price movements and uses them to predict future closing values. While the model does not incorporate external factors such as news or market sentiment, it effectively captures underlying trends within the data. This transforms the solution from a reporting tool into a predictive analytics platform, enabling forward-looking decision-making.
Key Findings
Analysis of the model output reveals several important insights:
- In most cases, the prediction gap remains within ±5%, indicating strong alignment between predicted and actual prices
- The model performs best during stable market conditions, where trends are consistent
- During periods of high volatility, the prediction gap increases slightly, which is expected due to sudden market movements
- Stocks that follow smoother trends tend to produce more reliable predictions
These findings demonstrate that the model is effective for trend-based forecasting, while also highlighting areas for future improvement.
Automation & Real-Time Experience
To keep the data fresh, Fabric Notebooks are scheduled to run automatically. This ensures that the Lakehouse is continuously updated and the Power BI report reflects the latest available data. As a result, users get a near real-time analytical experience without manual intervention.
Value Proposition
For finance teams managing portfolios or tracking market performance, this platform shifts the operating model. Traditional analysis waits for month-end reports. This system updates daily.
Finance AI simplifies stock analysis by:
- Centralizing data into one platform
- Automating data workflows
- Providing predictive insights
- Enabling interactive exploration
It allows users to move from static reporting to data-driven decision-making, supported by both historical and predictive analysis.
Future Improvements
The current model proves the concept. Production deployment at scale would require additional capabilities.
Future enhancements could include:
- News and sentiment integration
- Real-time data streaming
- More advanced predictive models
- Expansion to additional stocks and markets
Conclusion
Powerful financial analytics can run on accessible tools. This project combines Microsoft Fabric, Power BI, and machine learning to deliver scalable, interactive stock analysis.
Finance AI demonstrates how modern tools transform raw data into actionable insights, helping users make smarter and faster investment decisions. This is predictive finance built on a modern data platform. It shows what’s possible when data engineering, analytics, and machine learning operate within a single environment.
If you’re thinking about building something similar or want to know how this works in production, reach out. We build Fabric-based analytics solutions for finance teams.