Why Finance Decisions Still Move Too Slowly
Many finance teams still operate with a reporting cycle that was designed for a slower pace of business. Monday and Tuesday are spent pulling data from SAP, Oracle, and a dozen Excel files scattered across SharePoint. Wednesday is for cleaning it. Thursday for fixing broken formulas. Friday is when someone finally looks at the numbers. By the time the variance report is emailed, it’s already a week old.
I’ve seen finance directors spend twenty minutes in budget meetings arguing over which version of the P&L is correct. Not debating strategy. Not discussing decisions. Just figuring out which spreadsheet has the right numbers.
The real cost is not the meeting time. It is the delay in taking action. A supplier increases prices by 15% in March. The issue isn’t identified until April’s close in mid-May. By then, an extra $40,000 has already been spent. The variance appears as a red number in a report, and leadership asks, “Why didn’t we know this earlier?”
The data was always there. It was just locked inside systems that weren’t connected in real time and required hours of manual effort to analyze.
This is the gap AI and Power BI are designed to close. They reduce the manual reporting cycle so finance teams can focus on trend analysis, forecasting, and advising the business.
The Solution: Power BI as a Live Finance Decision Layer
Power BI connects directly to your ERP system, accounting software, and Excel budget files. No more Monday morning data pulls. No copying and pasting between systems. No consolidating five spreadsheets before you can answer a simple question. The data flows automatically.
What replaces that process is a live dashboard. On Tuesday morning, your CFO sees the current cash position, month-to-date spend by department, and budget variance by category all updated overnight. Clicking on “Marketing – 12% over budget” instantly drills down to reveal the Q2 campaign driving the overspend. The investigation takes seconds, not days. That alone eliminates most of the manual data work. AI is what makes the dashboard intelligent.
AI can scan financial data for patterns that are easy to miss in manual reviews. It flags when Days Sales Outstanding jumps from 42 to 51 days. It highlights when July’s travel expenses sit far outside historical norms and signals that something needs attention.
Instead of finance teams hunting through reports looking for issues, AI surfaces them automatically. It doesn’t just show charts, but it explains them. It generates plain English insights like: “Revenue increased 24% year-over-year, driven primarily by Electronics, which accounted for 64% of the growth.”
The impact is measurable. A month end closure that once took ten days now takes three. Budget variance analysis drops from eight hours to two. Root cause investigations that previously required multiple people over several days are narrowed down in seconds.
The work doesn’t disappear, rather it shifts. Finance teams move from asking
“Where did this variance come from?” to “Given this trend, what should we do next?” That’s the real transformation: from data cleanup to financial strategy.
Three Power BI AI Features That Matter Most in Finance
Power BI includes several AI features built specifically for business users. Three of them are particularly useful for finance teams looking to save time and improve accuracy.
Three Power BI AI Features That Matter Most in Finance
This is the biggest time-saver. Imagine Q2 operating expenses come in $340,000 over budget. Traditionally, that triggers a familiar process: pull GL detail, sort by department, scan line items, call department heads. It sometimes takes hours, sometimes days.
Key Influencers shorten that process. You point it at the variance and ask, “What’s driving this?” The AI analyzes dimensions such as department, product category, region, vendor, and time, then ranks the drivers by impact. Instead of guessing, you get a clear answer: “When Product Category is Electronics, expenses increase by an average of $1.39M.” That’s the root cause, identified in seconds.
Smart Narratives for Executive Commentary
These automatically generate written explanations from your data. When a dashboard shows revenue up 24%, margin down 3%, and Electronics driving most of the growth, Smart Narratives turns that into plain English: “Revenue increased 24% year-over-year, driven primarily by Electronics. Margin compression of 3% suggests pricing pressure or rising costs requiring investigation.”
This text updates automatically with each data refresh. Executives get context, not just charts. Reporting decks gain commentary without finance teams spending hours writing explanations. In practice, this alone can save several hours on every reporting cycle.
Forecasting with Confidence Bands
Power BI’s built-in forecasting uses historical patterns, seasonality, and trend behavior to project future performance. Instead of a single forecast line, it produces confidence and a realistic range where results are likely to land. That shaded area answers an important question: “How confident should we be in this projection?”
Unlike manual Excel forecasts that often extend a straight line, AI forecasting accounts for seasonal peaks, recurring dips, and historical volatility automatically. In practical comparisons, this approach consistently produces more reliable projections than simple linear trend extensions.
Together, these three capabilities cover most real-world finance needs: identifying root causes, explaining what happened, and anticipating what comes next. Everything else is incremental. These are the essentials.
Forecasting with Confidence Bands
Let me show you exactly how this works. This is the actual budget variance analysis I ran, with the real insights AI surfaced. The starting question was simple: How does our actual sales performance compare to budget, and what’s driving the gaps?
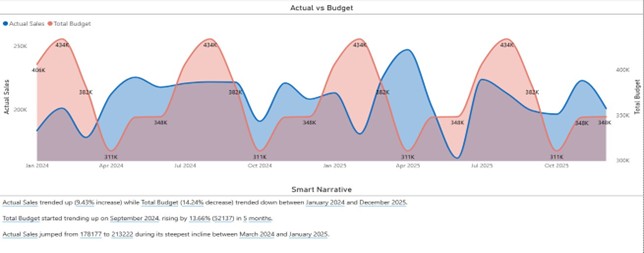
Figure 1: Actual Sales (blue line) shows growth trend while Total Budget (red area) demonstrates cyclical volatility
Actual Sales climbed steadily from 178K to 406K consistent growth trajectory across the period. Total Budget tells a different story. It cycles between peaks of 434K (repeated quarterly) and valleys of 311K, creating a wave pattern that reflects quarterly planning adjustments rather than smooth linear growth.
The Smart Narrative below the chart was generated automatically by AI. It analyzed the data, identified the trends, and wrote that explanation for you. You didn’t type a single word. And every time your data refreshes, the narrative updates automatically to reflect the latest numbers.
The AI analyzes dimensions such as department, product category, region, vendor, and time, then ranks the drivers by impact. The quarterly budget peaks at 434K suggest seasonal planning cycles, but the consistent 311K valleys indicate a baseline budget floor. April 2025 shows Actual Sales exceeding budget significantly, worth investigating what drove that outperformance. The consistent 434K budget peaks across quarters suggest predictable planning patterns you can leverage for next year’s forecast.
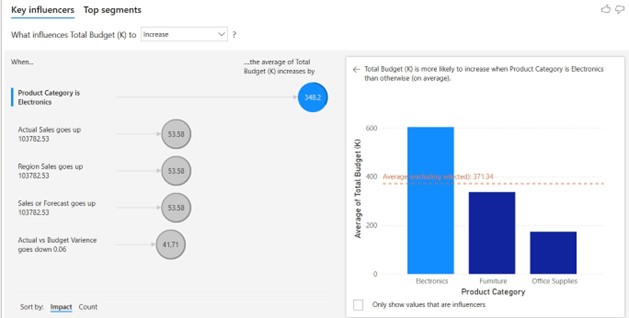
Figure 2: AI identifies that Electronics increases Total Budget by )348.2K on average the primary driver dominating budget allocation
When Product Category is Electronics, Total Budget increases by an average of 348.2K — significantly higher than Furniture (340K) or Office Supplies (180K). Electronics dominates budget allocation at around 600K, more than triple the Office Supplies budget.
What this means: Finance teams should prioritize Electronics variance monitoring. Auditors should concentrate on testing efforts here given the 3x budget concentration. Planning teams should build flexibility into Electronics budgets rather than treating all categories equally.
Time saved: 7.5 hours of manual investigation reduced to 30 seconds.
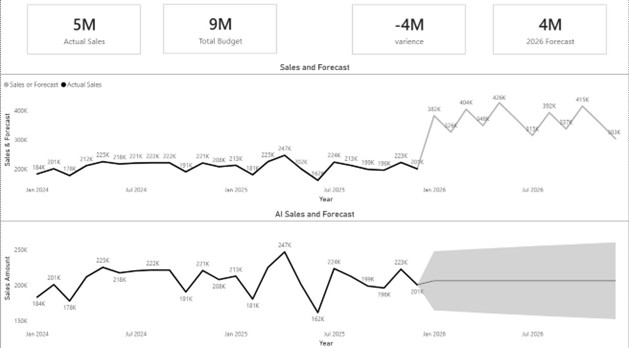
Figure 3: Manual forecast (top) projects growth to 400K+ monthly; AI forecast(bottom) shows decline to ~200K with confidence band showing uncertainty
The KPI cards at the top tell the current story: Actual Sales of 5M against a Budget of 9M create a -4M variance. The 2026 Forecast starts at 4M.
The manual forecast (top chart, gray line) projects steady growth. Sales climb from current 200K levels up to 426K by mid-2026. Clean, optimistic trajectory. This reflects analyst expectations, takes recent patterns, extends the trend forward, assumes continued growth. The AI forecast (bottom chart, gray shaded area) tells a different story. It projects sales declining toward 200K with that wide gray confidence band showing the uncertainty range could stretch from 150K to 250K. The AI detected the recent downward trend visible in late 2025 (that 162K drop in July) and incorporated it into the projection.
The gap: Manual says 400K+, AI says 200K. That’s a 100% difference, double the projection depending on which method you trust.
Which one is right depends on the purpose. A manual forecast reflects targets and initiatives. An AI forecast reflects patterns in historical data and supports risk aware planning. Manual forecast reflects where the business wants to go useful for target-setting and planning initiatives. AI forecast reflects what the data pattern suggests will happen useful for cash flow planning and risk management.
Power BI’s AI forecasting uses exponential smoothing and automatic seasonality detection methods proven to handle volatility better than simple linear trend lines. Notice in Figure 3 how the AI forecast detected the recent downward trend in Q4, December 2025 and adjusted accordingly, while the manual forecast continued projecting upward growth.
The confidence band (that gray shaded area in the AI forecast) shows the range of probable outcomes rather than pretending one number represents the future. This honest acknowledgment of uncertainty leads to better financial management planning for multiple scenarios instead of being surprised when a single-point forecast misses the mark.
Getting Started: Where Finance Teams See ROI First
The best starting point depends on where the manual work and delayed insight are costing you the most. In most finance teams, the quickest wins fall into one of three paths.
Start with close and variance analysis if month end takes too long.
Connect Power BI to your core sources and build a focused view of month to date results, budget variance, and key drivers. Automating refresh and using AI features such as Key Influencers can reduce time spent pulling data, reconciling numbers, and searching for the cause of variances.
Start with forecasting if accuracy and confidence are the bigger issue.
Build a forecasting view that includes historical patterns and confidence ranges, then compare it to your current manual approach. This helps teams plan with a realistic range of outcomes instead of relying on a single number that looks precise but hides uncertainty.
Start with real time monitoring if overruns show up weeks too late.
If overspends regularly become visible only after close, set up daily or near real time monitoring for the categories that matter most. Key Influencers can surface what is driving change early, giving leaders time to respond before the variance grows.
A simple rule of thumb is to start with one high impact question you need answered faster than today. For example, what is driving our largest budget variances, which cost categories are trending in the wrong direction, or where are we likely to miss plan next quarter. Build one dashboard that answers that question clearly, measure the time saved, then expand from there.
The learning curve is manageable. Most finance professionals become productive quickly when they start with a narrow scope and a clear success metric. You do not need advanced technical expertise to begin. You need a clear starting point, access to the right data sources, and a disciplined approach to measuring improvement as it shows up in cycle time, decision speed, and forecast confidence.
Conclusion: A Practical Path to Faster Finance Decisions
AI and Power BI help finance teams move faster by reducing the manual reporting cycle that consumes so much time each week. When data refreshes automatically and key drivers surface quickly, finance can spend less time reconciling numbers and more time interpreting what those numbers mean for the business.
The value shows up in practical ways. Month end close cycles shorten. Budget overruns are visible earlier, not weeks later. Variance conversations shift from debating which file is correct to discussing what action makes sense. Forecasts improve because teams can work with patterns, confidence ranges, and scenario thinking instead of relying on a single point estimate.
A simple path forward is to start with one high impact workflow and measure the change. Pick the area where delays are most expensive, connect the right data sources, and build a dashboard that answers one decision critical question better than today.
Once the team sees time savings and clearer insight, it becomes easier to expand to additional processes.
The tools are already available. The advantage comes from using them with focus and discipline, then scaling what works across the finance function.