Imagine you’re building a Power BI report, and everything is running smoothly. Your logic is simple, your measures are clear, and the business is happy. But as the report evolves, new requirements roll in — more KPIs, more time perspectives, and more comparisons. Suddenly, you’re duplicating the same calculations over and over again. What started as a handful of measures has now exploded into a complex web of nearly identical calculations, all using the same underlying logic. The more the model grows, the harder it becomes to manage.
What starts as a simple reporting requirement quickly snowballs into a measure explosion. A single KPI rarely exists in just one form. Business users want to analyze the same metric across multiple reporting perspectives — MTD, QTD, and YTD — while also comparing it against Budget, Forecast, or Prior Year using both Variance and Variance % calculations. As reporting requirements evolve, the semantic model fills with hundreds of nearly identical measures, where the names change constantly, but the core calculations remain the same.
Take a finance model as an example. Net Revenue, Gross Profit, EBITDA, Expenses, Headcount, Inventory, and many other KPIs often follow the same reporting structure. A single KPI might require separate measures for Variance and Variance % across different time periods, such as Current Month, YTD, Prior Year, and Rolling 12 Months. When you apply this pattern to multiple KPIs, the model quickly becomes cluttered with dozens, if not hundreds, of similar measures, leading to unnecessary complexity.
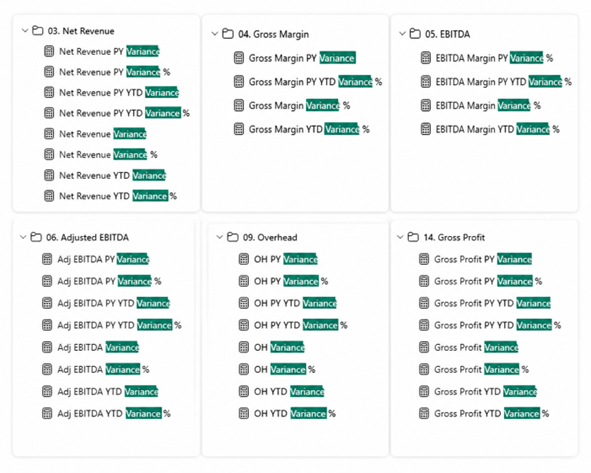
At the core of Variance and Variance % calculations is a simple, repeating logic: Variance calculates the difference between Actual and Baseline, while Variance % calculates that difference as a percentage of the Baseline. The underlying formula remains the same, but what changes is the Actual, the Baseline, and the date context — which KPI is being measured, which baseline is used for comparison, and which time period is applied.
This is where DAX User-Defined Functions (UDFs) truly shine. UDFs allow you to define logic once, declare the inputs, and reuse it across multiple measures without duplicating calculations. While UDFs have broad applications in DAX for various types of logic, this blog focuses on how they can standardize Variance and Variance % calculations. The result is a more scalable semantic model with less duplicated DAX, cleaner architecture, and a single source of truth for all reusable business logic.
What Are DAX User-Defined Functions?
A DAX user-defined function is a parameterized DAX expression that you define once and reuse throughout a semantic model — in measures, calculated columns, visual calculations, and even inside other functions. If you have used custom functions in any programming language, the concept is the same: encapsulate logic, name it, define its inputs, and call it wherever you need the result.
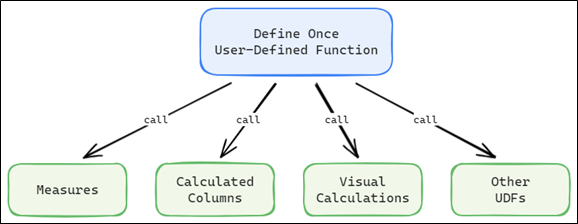
What makes UDFs distinct is their status as first-class model objects. They live alongside tables, measures, and relationships as a dedicated object type — listed under the Functions node in Model Explorer, managed through DAX Query View or TMDL View, and stored in functions.tmdl when you save as a Power BI Project (PBIP). UDFs accept scalar, table, or expression parameters and can return either a scalar value or a table.
Here is an example of how UDFs can be applied to standardize Variance and Variance % logic across multiple KPIs:
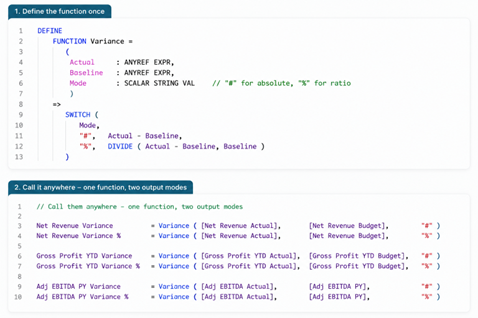
In this example, instead of creating new DAX measures for each reporting context, you create two reusable functions — Variance and VariancePct — and use them across different KPIs and time perspectives. Whether you’re comparing Net Revenue, Gross Profit, or EBITDA, you’re reusing the same logic and simply passing different arguments to the functions.
This centralization reduces redundancy in your model, making it easier to maintain and update. Any changes to the variance logic, such as rounding or handling missing data, can be made in one place, and all dependent measures will automatically reflect the change.
One function. Multiple measures. No duplicated logic.
A common point of confusion: DAX UDFs are not the same as Power Query custom functions. Power Query functions are written in M and run during data refresh to transform and load data before it reaches the model. DAX UDFs run inside the formula engine at query time — responding to filter context, row context, and user interactions in real time. Different engines, different languages, different purposes. If Power Query shapes the data coming in, DAX UDFs shape the calculations going out.
Why UDFs Matter for Teams
The immediate benefit — write once, reuse everywhere — is obvious. But the deeper impact shows up in how teams work.
Consider what happens when a model has no single source of truth for a calculation. Two developers write the same percentage logic with different edge-case handling. Both measures pass testing because both are technically correct — just not identical. Reports built on each version produce slightly different numbers, and the discrepancy only surfaces when a stakeholder compares dashboards side by side in a steering meeting. The issue was never a bug. It was the absence of a shared definition.
UDFs turn business rules into governed, testable objects. An architect defines the approved logic, validates it independently, and publishes it as a function. Downstream developers do not reinterpret the rule — they call it. This is a workflow change, not just a coding convenience. It moves DAX development closer to how software engineering teams operate: shared libraries, single responsibility, version-controlled logic.
For organizations scaling Power BI across departments, this also simplifies onboarding. A new developer joining the team does not need to reverse-engineer 40 measures to understand how margin is calculated — they read one function definition. The model becomes self-documenting in a way that measures alone never achieved.
Key Takeaway: SQLBI called UDFs _”the most significant update to the DAX language since 2015, when Microsoft introduced variables.”_ In five years, measures longer than 20 lines without function calls will look as outdated as measures without variables look today.
Enabling DAX UDFs (Preview Feature)
DAX UDFs are available starting with the September 2025 release of Power BI Desktop. Since the feature is still in public preview, you need to enable it manually:
- Open Power BI Desktop (September 2025 version or later)
- Go to File → Options and settings → Options
- Under Preview features, check DAX user-defined functions
- Click OK and restart Power BI Desktop
After the restart, the Functions node appears in Model Explorer, and you can start defining UDFs through DAX Query View or TMDL View.
Compatibility level matters. UDFs require compatibility level 1702 or higher. Power BI Desktop automatically upgrades your model to the required level when you create your first UDF — no manual steps required.
⚠️Preview Reminder: Behavior and limitations may change between releases. Test thoroughly before using UDFs in production, and watch Microsoft’s monthly release notes for updates.
UDF Syntax and Structure
With the feature enabled, the next step is understanding how a UDF is built. If you have written functions in any programming language, the structure will feel familiar — a name, parameters, and a body that returns a result. DAX keeps the syntax minimal, but there are a few naming rules and conventions worth knowing upfront to avoid errors down the line.
Every function follows the same anatomy:
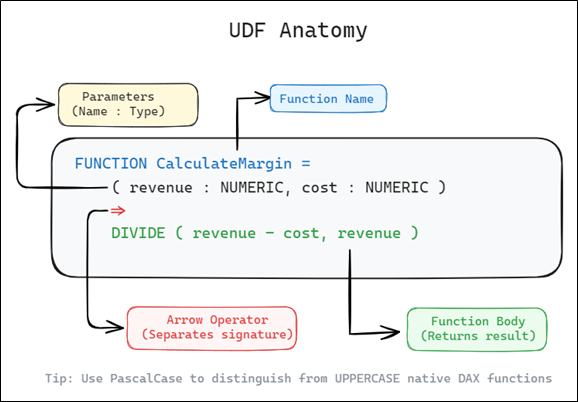
The FUNCTION keyword opens the definition, followed by the function name — PascalCase is recommended to distinguish your UDFs from UPPERCASE native DAX functions. Parameters go inside the parentheses (name, type, and an optional passing mode covered in the next section), and the => arrow separates the signature from the body.
Naming Rules:
Names must be unique, alphanumeric characters, underscores, and periods only — no spaces or special characters, no leading/trailing or consecutive periods, and no conflicts with built-in DAX functions or reserved words. Periods double as a namespace convention, so teams can organize functions by domain: Finance.GrossMargin, TimeIntel.YOY, HR.Attrition.Rate — useful when your model grows to dozens of reusable functions.
Constraints Worth Knowing:
There is no explicit return type declaration — the engine infers whether the function returns a scalar or a table from the body expression. Recursion is not supported, neither direct nor mutual, and you cannot overload function names with different parameter signatures. Optional parameters are also not supported — every parameter you define is required at call time. One name, one definition.
Parameter Types and Modes
Every parameter in a UDF carries a hidden design decision: when does it get evaluated, and who controls the context? Get this right and the function works seamlessly across any visual, measure, or iterator. Get it wrong and the function returns numbers that look plausible but are silently incorrect — no error, no warning, just wrong results in production.
Type Hints:
Every parameter can include up to three optional hints in the format [Type] [SubType] [ParameterMode]. You can specify all three, some, or none — omitting everything defaults to AnyVal VAL.
For example, Quantity : SCALAR INT64 EXPR tells the engine to expect a single integer value, evaluated lazily inside the function body.
| Hint | Option | SubType | Purpose |
| Type | AnyVal (default) | — | Accepts a scalar or a table |
| Scalar | INT64, DECIMAL, DOUBLE, NUMERIC, STRING, BOOLEAN, DATETIME | Accepts a single value, narrowed by SubType | |
| Table | — | Accepts a table | |
| AnyRef | — | Accepts a reference to a column, table, calendar, or measure. Always implies EXPR. | |
| ParameterMode | VAL (default) | — | Eager — evaluated once at call time |
| EXPR | — | Lazy — evaluated inside the function body |
The first two hints control what goes in. The third – ParameterMode – deserves special attention. The type hint tells the engine what kind of value to expect, but the mode controls something more consequential: when that value gets evaluated, and who controls the context.
VAL is the default. The argument is evaluated once at call time, and the result is passed into the function as a fixed value — exactly like a DAX variable. No matter how many times the function body references that parameter, it always returns the same value. This is efficient and predictable, and it’s the right choice when you need a pre-calculated number or a materialized table.
EXPR defers evaluation. The argument is not resolved at call time — instead, the raw expression is passed into the function body and evaluated there, in whatever filter context the function creates. It behaves like a measure reference: context-sensitive, re-evaluated each time it’s referenced, and capable of producing different results in different contexts. Use EXPR when your function wraps a parameter inside CALCULATE, an iterator, or any context-modifying operation.
Why This Matters: The Context Transition Trap
Consider a function that calculates Month-To-Date for any measure you pass in:
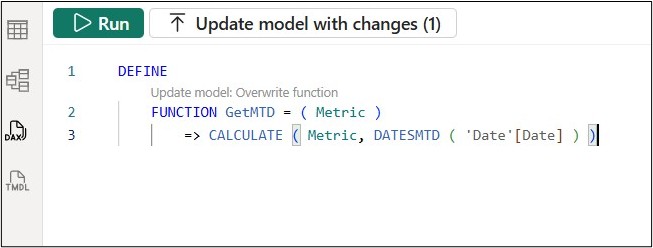
Create a measure — MTD Sales = GetMTD ( [Total Sales] ) — and place it in a daily grain visual:
| Date | Total Sales | Expected MTD | MTD Sales |
| Feb 1 | 10,000 | 10,000 | 10,000 |
| Feb 2 | 8,000 | 18,000 | 8,000 |
| Feb 3 | 12,000 | 30,000 | 12,000 |
No error. No warning. But every row returns the daily value — identical to [Total Sales]. The function quietly does nothing.
Because Metric defaults to VAL, [Total Sales] is evaluated _before_ the function runs. For Feb 2, Metric arrives as the frozen number 8,000. Inside the body, CALCULATE( 8000, DATESMTD(‘Date'[Date]) ) executes — DATESMTD expands the date range, but there is no expression left to re-evaluate in the new context. The result is just 8,000.
One keyword fixes it:
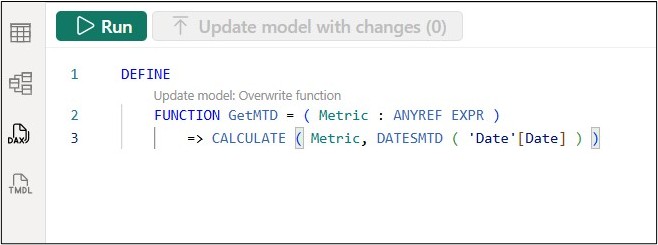
Now Metric arrives as the unevaluated expression [Total Sales]. DATESMTD expands the filter to Feb 1 through the current date, and [Total Sales] evaluates across that full range — producing 10,000 → 18,000 → 30,000 as expected.
Same function body. Same measure call. One keyword difference. Completely different results — and the VAL version never tells you something is wrong.
📌 Pro Tip: When your function wraps a parameter inside CALCULATE or any iterator, always use EXPR mode. This ensures context transition works correctly whether the caller passes a measure reference or a raw expression — the mark of a professionally written UDF.
Where to Create & Manage UDFs
UDFs are first-class model objects, which means they need a home — and Power BI Desktop gives you three places to work with them. Each serves a different purpose in the authoring workflow.
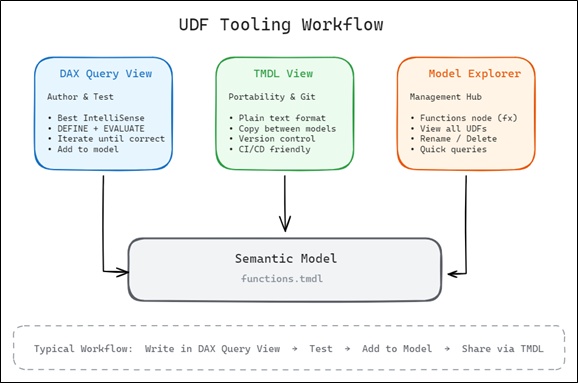
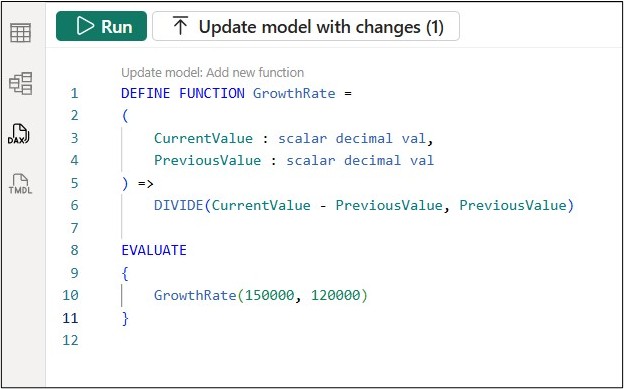
DAX Query View is where most UDF development happens. It offers the best IntelliSense support, syntax highlighting, and — critically — the ability to test your function before committing it to the model. Write your function inside a DEFINE block, run it with EVALUATE, and iterate until the logic is right. When you’re satisfied, click the code lens prompt (“Update model: Add new function”) to add it to your semantic model. You can also right-click any existing function in Model Explorer and choose from Quick queries: Evaluate, Define and evaluate, or Define all functions — useful for inspecting or reusing functions you’ve already built. If your syntax is wrong, the editor highlights the issue immediately — no waiting until runtime to discover problems.
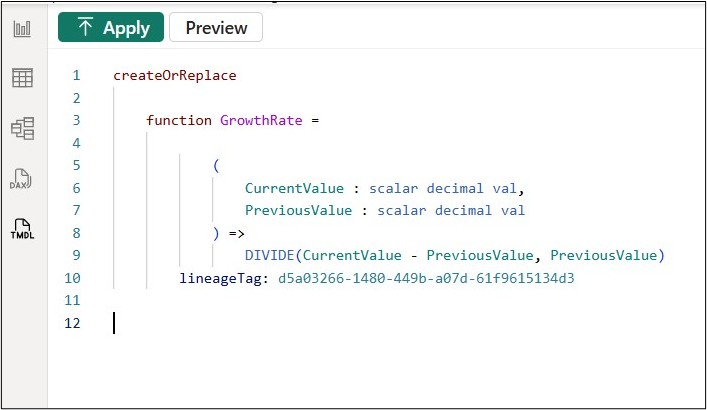
TMDL View shines when you need portability. Every UDF in your model is stored in functions.tmdl within the Power BI Project (.pbip) folder structure. This makes copying functions between semantic models straightforward — open the TMDL script, copy the function definition, paste it into another model’s TMDL View, and apply. It’s also the format that integrates with Git, so your functions get versioned alongside everything else in your project. Unlike binary .pbix files, TMDL is plain text — readable, diffable, and merge-friendly.
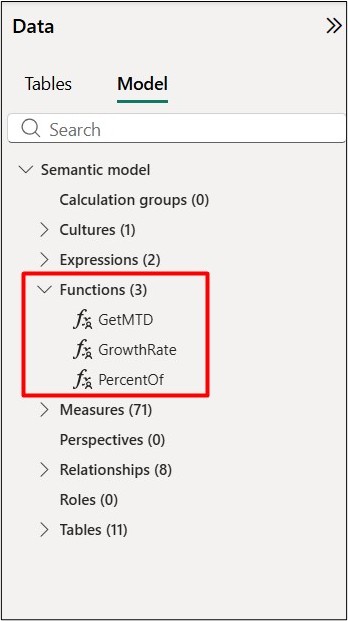
Model Explorer is the management hub. All UDFs appear under a dedicated “Functions” node, giving you a single place to view, rename, or delete them. Right-click context menus provide quick access to scripting and evaluation options without switching views. Look for the _fx_ icon — that’s how Power BI distinguishes functions from measures and tables.
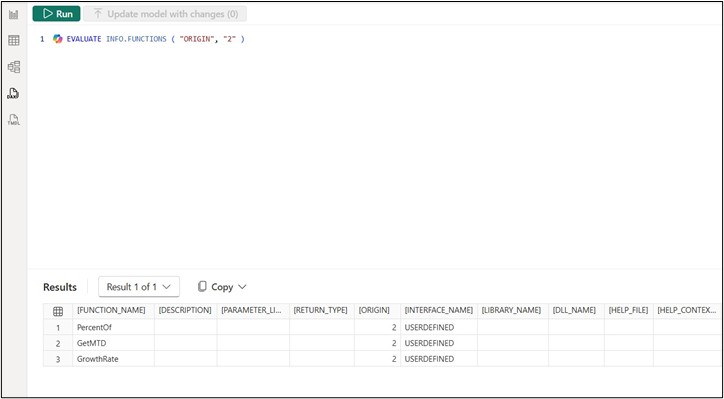
For programmatic inspection, you can query your model’s UDFs using Dynamic Management Views. The INFO.FUNCTIONS DMV returns metadata about all functions in the model; filter by ORIGIN = 2 to see only user-defined functions. Useful for documentation scripts or automated model validation in CI/CD pipelines.
Using UDFs in Your Model
Once a function is defined and saved, you can call it anywhere DAX is supported — measures, calculated columns, visual calculations, and even other UDFs. Each context has its own nuances.
In Measures
This is the most common use case. A UDF called inside a measure operates within the full filter context of the visual.
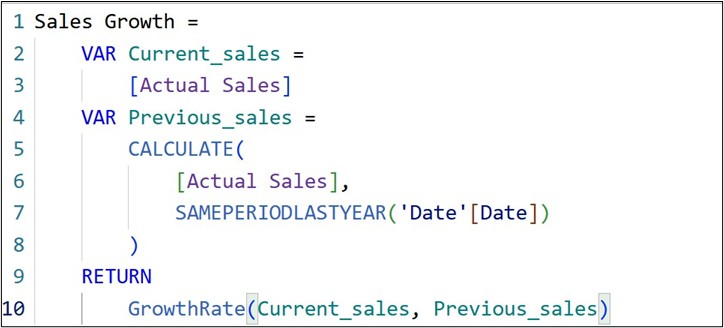
The function receives whatever values Current_sales and Previous_sales evaluate to in the current context, applies its logic, and returns the result. Nothing special required — it just works.
In Calculated Columns
Calculated columns evaluate row by row during data refresh, not at query time. When calling a UDF here, ensure the function returns a consistent data type. If there’s any ambiguity, wrap the call in CONVERT to enforce the expected type:
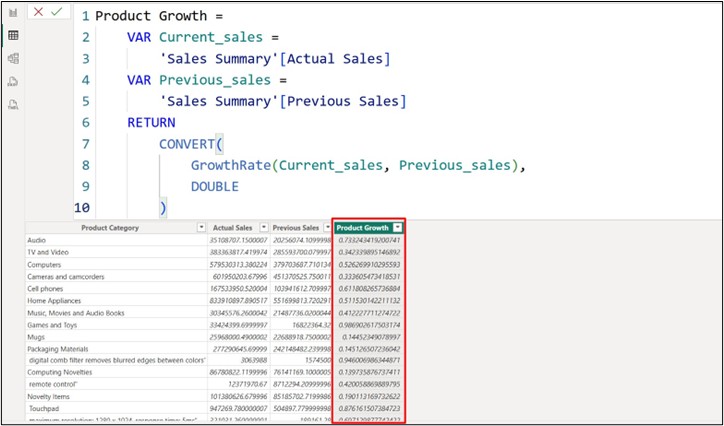
This avoids subtle type mismatches that can surface as errors later — especially when the column feeds into other calculations.
In Visual Calculations
UDFs work in visual calculations too, letting you encapsulate logic that would otherwise clutter the visual-level formula bar. Combined with visual calculation functions like PREVIOUS, you get powerful row-to-row comparisons:
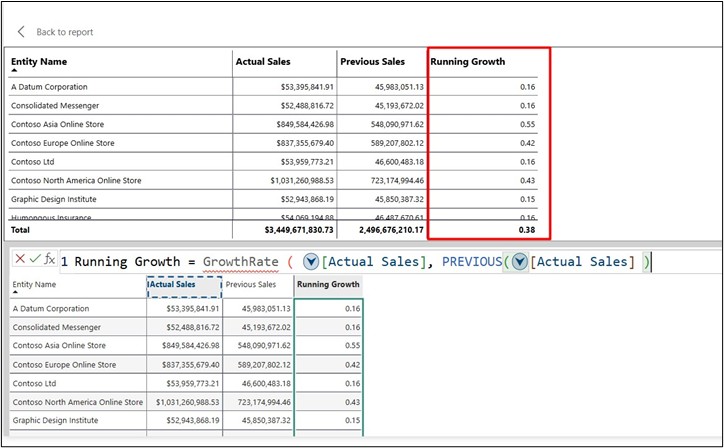
One caveat: IntelliSense support is limited in the current preview, so you won’t get autocomplete for your custom functions. The function still executes correctly — you just have to type the name from memory.
In Other UDFs (Composition)
Functions can call other functions. This enables modular, layered logic where each function handles one responsibility. For example, a formatting wrapper that returns display-ready text:
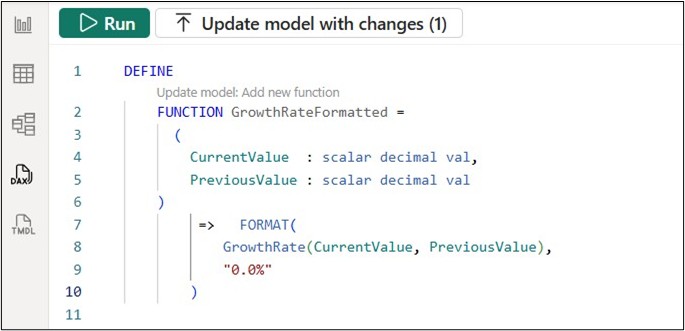
Build small, focused functions — then compose them into higher-level calculations. A GrowthRateFormatted call returns “25.0%” instead of 0.25 — ready for card visuals or tooltips without additional formatting logic in your measures.
This is where UDFs start to feel like real programming.
Model-Dependent vs. Model-Independent Functions
Not all UDFs are created equal when it comes to portability. Understanding this distinction early will save you from rewriting functions every time you start a new project.
Model-Dependent Functions
These functions reference specific objects in your model by name — a particular table, column, or measure. They’re tightly coupled to the model where they were created.
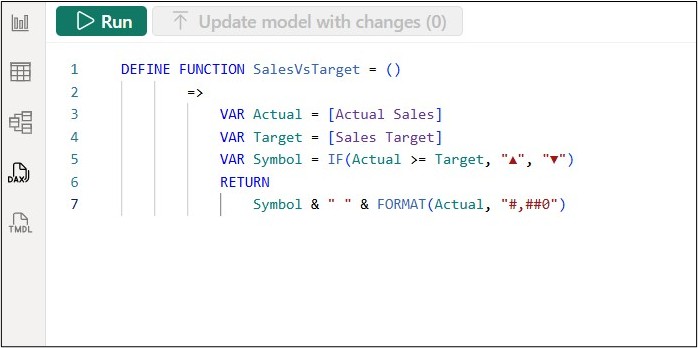
Call it with just SalesVsTarget() — clean and simple. But this function only works if your model has [Actual Sales] and [Sales Target]. Copy it to another model with different measure names and it breaks immediately. That said, model-dependent functions are perfectly fine for single-model use — just don’t expect them to travel.
Model-Independent Functions
These functions accept all dependencies as parameters. No hardcoded references, no assumptions about your model structure.
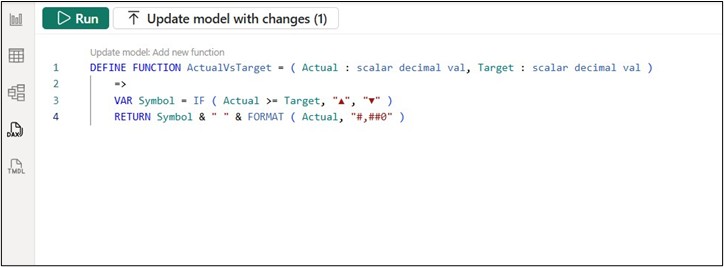
Same logic, different design. Call it with ActualVsTarget( [Actual Sales], [Sales Target] ) — more verbose, but works in any model. Sales, inventory, HR metrics, anything with an actual-vs-target comparison. If you’re building functions meant to be shared across projects or teams, this is the pattern to follow.
| Aspect | Model-Dependent | Model-Independent |
| Call syntax | SalesVsTarget() | ActualVsTarget( [Actual Sales], [Sales Target] ) |
| Portability | ❌Breaks in other models | ✅Works anywhere |
| Verbosity | Cleaner at call site | More typing each time |
| Best for | Internal reuse, complex logic | User-facing dynamic switching |
DAXLib.org — The Community Library
SQLBI maintains DAXLib.org, a free, open-source repository of model-independent UDFs. Over 30 libraries are available — SVG visuals, formatting utilities, conversions, common patterns — all ready to import.
The workflow is simple: browse the library, copy the TMDL script, paste it into your model’s TMDL View, and apply. Within seconds you have battle-tested functions without writing a line of code.
UDFs vs. Calculation Groups
By now you might be thinking: wait, I’ve been using Calculation Groups for years to avoid repeating logic. How is this different? Calculation Groups arrived in 2019 with a similar promise — write once, apply everywhere. But they solve fundamentally different problems.
The differences become clear when you put them side by side:
| Aspect | UDFs | Calculation Groups |
| Parameters | ✅Support multiple typed parameters | ❌No parameters |
| Grouping | ❌Cannot be grouped (use namespaces) | ✅Items grouped together |
| Scope | Called explicitly in DAX expressions | Applied automatically to measures in scope |
| Use Case | Building cleaner, reusable measures | Applying time intelligence variations (YTD, LY, etc.) |
| Portability | Across models via libraries / TMDL | Within model |
| Invocation | Like any DAX function call | Via slicer or report interaction |
When to use which?
The choice comes down to who controls the calculation and when it runs. UDFs are developer tools; Calculation Groups are user-facing filters.
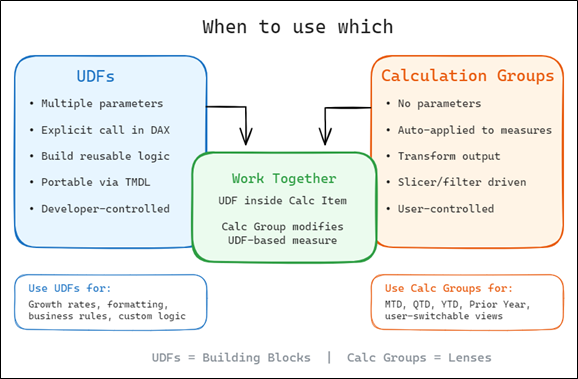
Use UDFs when you want to encapsulate logic that you’ll call explicitly — growth rates, formatting, business rules, anything where you control when and how it runs.
Use Calculation Groups when you want to apply transformations to existing measures dynamically — letting report users switch between MTD, QTD, YTD, or Prior Year without creating separate measures for each.
They work together.
A UDF can be called inside a Calculation Item. Imagine a GrowthRate function used within a “vs. Prior Year” calculation item — the Calculation Group handles the time shift, the UDF handles the math. You can also go the other direction: a measure that calls a UDF can still be modified by a Calculation Group at runtime.
Think of UDFs as building blocks and Calculation Groups as lenses. One constructs the logic; the other lets users view it differently.
Current Limitations (Preview)
UDFs are powerful, but they’re still in preview. Before you go all-in, know what’s not yet supported.
| Limitation | Details |
| Cannot author in Service | UDFs must be created in Power BI Desktop or external tools |
| No hide/unhide | Cannot hide UDFs from the model |
| No display folders | Cannot organize UDFs in folders (use dot-namespaces instead) |
| No translations | Cannot combine UDFs with object translations |
| No recursion | Recursive or mutually recursive functions not supported |
| No function overloading | Cannot create multiple functions with the same name but different parameters |
| No optional parameters | All parameters are required |
| Limited IntelliSense | TMDL View, visual calculations, and live connect models have limited autocomplete |
| No auto-rename | References not auto-updated when renaming objects a UDF depends on |
| Requires tables | UDFs not supported in models without at least one table |
The auto-rename limitation deserves extra attention. If you rename a measure or column that a UDF references, the function body still contains the old name — and it will break silently. Until this is fixed, double-check your UDFs after any renaming operations.
Also expect occasional red underlines in the editor — certain advanced scenarios like passing columns as expr parameters can trigger parser inconsistencies even when the code is valid. When in doubt, press F5 (or click Run) and execute it anyway.
This is a Public Preview feature. Expect rough edges, changes, and improvements before General Availability. That said, the core functionality is solid enough for development and testing — just be mindful when deploying to production.
Conclusion
We’ve covered a lot of ground — from syntax basics and parameter modes to tooling workflows, model-dependent vs. model-independent design, and how UDFs compare to Calculation Groups. If there’s one takeaway, it’s this: UDFs aren’t just a new feature. They’re a shift in how we think about writing DAX.
For developers, UDFs mean cleaner, more maintainable code — no more copy-pasting the same logic across dozens of measures. For architects, they bring governance and standardization to enterprise models. For teams, they reduce duplication and ensure consistent business logic across reports.
Should you adopt now? If your models have repeated patterns, frequently changing business rules, or you’re already comfortable with DAX Query View and TMDL workflows — yes, start today. The preview is stable enough for development and testing. If your models are simple or you depend on features not yet supported (display folders, Service authoring), waiting for GA is reasonable. But don’t wait to learn.
The ecosystem is already moving. DAXLib.org offers 30+ ready-to-import libraries. SQLBI’s Definitive Guide to DAX, Third Edition covers UDFs in depth, and their updated Mastering DAX video course includes full UDF coverage. The community isn’t waiting for GA — and neither should you.ss
📌Start now. Enable the preview, build a few simple functions — GrowthRate, ActualVsTarget, whatever fits your work. Get comfortable with the syntax, the parameter modes, the testing workflow. When GA arrives, you won’t be learning — you’ll be leading.