
How a production-grade semantic model and Inforiver’s no-code reporting layer deliver executive-ready financial reporting in Power BI.
Financial reporting in Power BI is deceptively hard. The native matrix visual was built for slice-and-dice analytics, not for the rigid, structured world of P&L statements, EBITDA bridges, and multi-period Balance Sheets that CFOs and finance directors expect to see.
According to Lumel, the makers of Inforiver, a moderately complex P&L statement takes a typical Power BI expert around 5 hours to build natively, and an average user with basic to intermediate DAX skills 3 to 5 days. Inforiver claims to deliver the same statement 10x to 30x faster, sometimes in as little as 5 minutes.
This post walks through a real-world implementation: a financial model built on a robust Power BI semantic model (defined in TMDL), with Inforiver sitting on top as the presentation and calculation layer.
| Who this is for: Power BI developers who want to understand the right way to build a financial semantic model, and finance/business analysts who want to understand what Inforiver actually does under the hood, and why the combination is so powerful. |
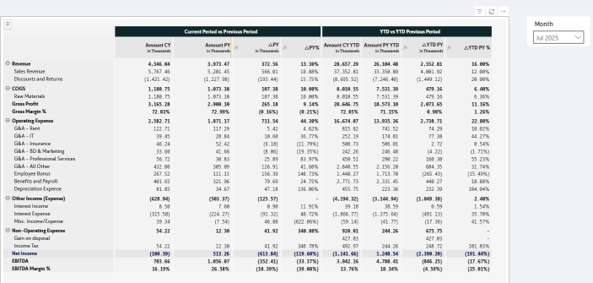
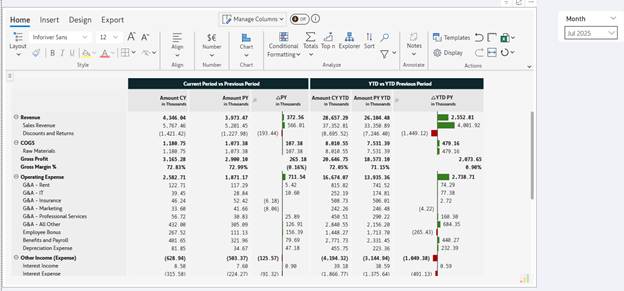
Final report — Full Inforiver financial statement
Why Power BI Struggles with Financial Reporting (And How to Fix It)
If you have ever tried to replicate a proper P&L statement in a standard Power BI matrix visual, you know the frustration. Lumel’s own analysis identifies eight specific pain points; here are the four that bite hardest in production:
- Sign conventions: Revenue and liability accounts carry opposite signs in GL systems. Displaying them correctly requires conditional logic that lives awkwardly in DAX.
- Fixed row ordering: Finance teams want Revenue → COGS → Gross Profit → OpEx → EBITDA. Power BI sorts alphabetically or by value.
- Calculated subtotals: Gross Profit, EBITDA, Adjusted EBITDA are derived rows, not dimension members. Native visuals have no concept of an inserted calculated row.
- Presentation-grade formatting: Indentation by hierarchy level, bold subtotals, traffic-light variances, grouped column headers. Impossible without workarounds in native Power BI.
The answer is not to fight Power BI’s native visuals harder. It is to split responsibilities correctly: let DAX and the semantic model handle data integrity and business logic, and let Inforiver handle everything a finance user would do in Excel.
Visual Calculations in Power BI: An Industry Shift Beyond DAX
The architectural pattern advocated in this post (pushing presentation logic out of DAX and into the visual layer) is not a niche opinion. It is the direction the entire Power BI ecosystem has been moving in for several years.
Marco Russo, co-author of The Definitive Guide to DAX and the most authoritative voice on the language globally, has been advocating for visual-level calculations on his SQLBI blog since at least 2022, including a widely-cited proposal for visual calculations in DAX. In a 2022 panel discussion, Russo moderated a debate between Lumel’s CEO and Reid Havens (Microsoft MVP and Inforiver Ambassador) titled “Visual Formulas vs DAX”, the entire premise: some calculations belong in the visual, not the model.
In February 2024, Microsoft itself added Visual Calculations as a preview feature to native Power BI, formally validating the direction. Inforiver got there years earlier, and goes much further than the native preview in what it allows finance users to do at the visual layer.
| THE ARCHITECTURAL ARGUMENT Not everything belongs in DAX. The Inforiver bet, now echoed by Microsoft, is that financial-statement layout, calculated subtotals, time-shifted comparisons, and presentation logic are visual concerns. This blog is not arguing for an exotic pattern. It is documenting how to build a real production financial model along a path that the most respected DAX authority and Microsoft’s own product roadmap have both endorsed. |
Building Production-Grade Financial Semantic Models in Power BI
Inforiver amplifies a well-designed semantic model. It cannot compensate for poor data structure or incorrect business logic. The semantic model must be correct before Inforiver touches the data.
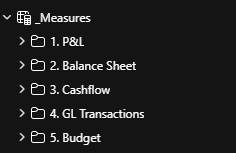
The _Measures Table Pattern
All measures live in a single dedicated calculated table called _Measures. This keeps the model clean, organises measures into display folders, and makes TMDL version control significantly easier.
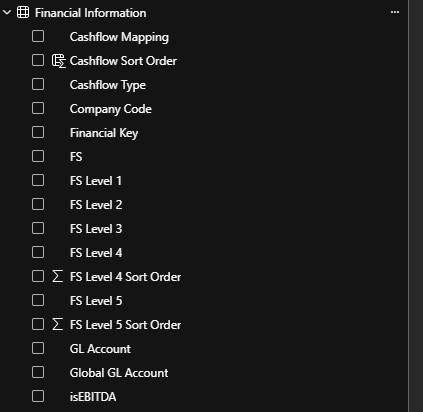
The Financial Information Hierarchy
The Financial Information table provides a five-level account hierarchy that drives both DAX logic and Inforiver’s row grouping:
| Level | Examples | Role in the Model |
| FS Level 1 | Asset, Liability, Net Income | Top-level sign convention logic in Balance Sheet |
| FS Level 4 | Revenue, COGS, Operating Expense, Add Back | P&L Categorisation; drives Inforiver row grouping |
| FS Level 5 | Gross Revenue, Subs & Reimbursable, Cash – Operating | Account-level filtering; specific sign overrides |
Measure Folder Structure
The measures are organised into numbered display folders that mirror the financial statement structure:
- 01. Base Amounts: Total Accounting Amount, Total Transaction Amount, Budget
- 02. P&L: PnL Amount, Net Income, Net Margin, COGS Actual
- 04. Gross Margin: Gross Margin Actual, Budget, Variance %
- 05. EBITDA: EBITDA, EBITDA Margin Actual, EBITDA Budget
- 06. Adjusted EBITDA: Adjusted EBITDA, Add Back, Adj EBITDA Actual, Adj EBITDA Budget
- 07. Balance Sheet: Balance Sheet Amount, PM, Beginning Cash Balance
- 08. Cashflow: Cashflow Amount, Change in Cash, Cash Flow Budget
| Note on time intelligence: Time-shifted variants (PY, YTD, PY YTD, TTM) are intentionally minimized in this design. Inforiver’s Smart Analysis feature generates these comparisons automatically at the visual level (covered in Section 8), keeping the semantic model lean and focused on base business logic. |
Solving Sign Conventions in Financial DAX Models
The single most painful part of any financial model in Power BI is sign conventions. In most GL systems, both revenue and expenses are stored as positive numbers. Yet in a P&L, revenues increase profit and expenses reduce it. Getting this wrong means every number in your report is wrong.
This model handles sign conventions at the measure level using a clean account_sign pattern:
| // DAX — PnL Amount (sign-aware base measure) |
| measure ‘PnL Amount’ = VAR account_sign = IF( MAX(‘Financial Information'[FS Level 4]) IN {“Revenue”, “Other Income (Expense)”}, -1, 1 ) VAR amount = [Total Accounting Amount] * account_sign RETURN amount |
Revenue accounts are stored as credits (negative in the GL), so multiplying by -1 flips them positive for display. All expense accounts remain positive. This is evaluated in filter context, meaning it automatically applies to whatever account level is in scope.
| Why handle this in DAX instead of Inforiver? Inforiver provides an Invert Sign option for individual rows at the visual level, with a companion Influence Total option that controls whether the inversion affects only the displayed value or the aggregation as well. Many simpler implementations rely on these. This model handles sign conventions in DAX because the same logic is consumed by multiple Inforiver visuals, paginated reports, and Excel exports, centralizing it in the semantic model guarantees consistency. |
EBITDA and Adjusted EBITDA: Building Composable Measures
One of the cleaner design decisions in this model is how EBITDA and Adjusted EBITDA are built compositionally, rather than as monolithic calculations:
| // DAX — EBITDA and Adjusted EBITDA (composable pattern) |
| measure EBITDA = [Pre Tax Profit] + [Goodwill] + [Depreciation & Amortization] + [Net Interest Expense] measure ‘Adjusted EBITDA’ = [EBITDA] + [Add Back] measure ‘Add Back’ = CALCULATE( [PnL Amount], ‘Financial Information'[FS] = “IS”, ‘Financial Information'[FS Level 4] = “Add Back” ) |
This layered approach means each component can be validated independently and reused without duplicating logic. The Add Back measure is isolated. Any change to the GL accounts that qualify as add-backs only needs to happen in one place.
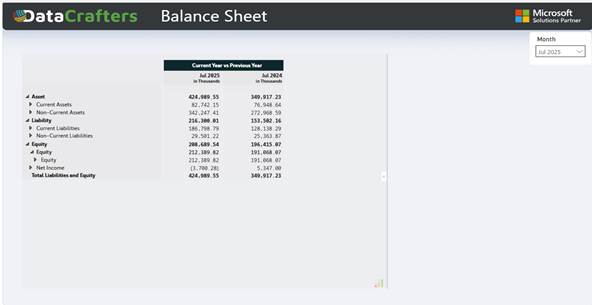
Balance Sheet: Multi-Condition Sign Logic and Cumulative Calculations
The Balance Sheet requires a more sophisticated approach. Sign conventions there depend on both the FS Level 1 classification and specific account names:
| // DAX — Balance Sheet Amount (multi-condition sign logic + cumulative filter) |
| measure ‘Balance Sheet Amount’ = VAR account_sign = SWITCH(TRUE(), MAX(‘Financial Information'[FS Level 1]) IN {“Liability”, “Net Income”}, -1, MAX(‘Financial Information'[FS Level 5]) IN {“Retained Earnings”}, -1,1 ) VAR SelectedMonthOffset = MAX(‘Calendar'[Month Offset]) RETURN CALCULATE( [Total Transaction Amount] * account_sign, REMOVEFILTERS(‘Calendar’), ‘Calendar'[Month Offset] <= SelectedMonthOffset ) |
Why REMOVEFILTERS + Month Offset?
Balance Sheet amounts are cumulative. You sum everything up to and including the selected month.
By removing all calendar filters and re-applying only a Month Offset boundary, this measure correctly computes a running balance regardless of what date slicers the user has applied on the report page.
Cash Flow Statements: Building from Balance Sheet Movements
The Cash Flow statement is derived directly from Balance Sheet movements using the indirect method, it stays automatically consistent with the Balance Sheet:
| DAX — Cashflow Amount (Balance Sheet movement, indirect method) |
| measure ‘Cashflow Amount’ = VAR _sign = SWITCH(TRUE(), MAX(‘Financial Information'[FS Level 1]) = “Asset”, -1, 1 ) VAR cashflow = CALCULATE( ([Balance Sheet Amount] – [Balance Sheet Amount PM]) * _sign, KEEPFILTERS( ‘Financial Information'[FS Level 5] <> “Cash and Cash Equivalents” ) ) RETURN COALESCE(cashflow, 0) |
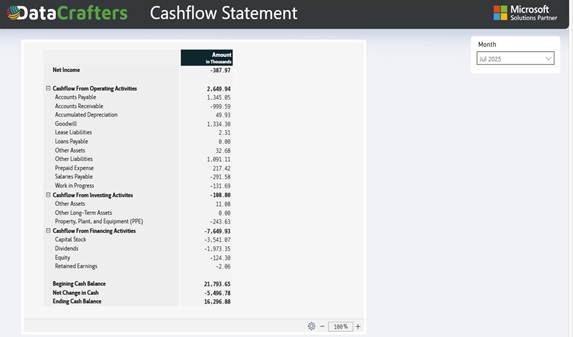
Cash accounts are excluded from Cashflow Amount (captured separately in Change in Cash), and asset account movements are sign-flipped. The consistent use of COALESCE(…, 0) throughout the model prevents blank values from cascading into parent subtotals.
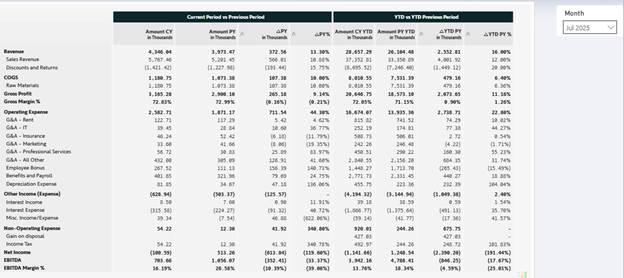
Inforiver for Financial Reporting: Visual Layer Features
With a solid semantic model in place, Inforiver v3.3.9.1 transforms the data into a presentation-grade financial statement without requiring a single additional line of DAX. According to Lumel’s “14 Financial Modeling Templates” eBook, a financial report that traditionally takes 2-5 days in Power BI can be built in Inforiver in under an hour.
Hierarchical Layout and Ragged Hierarchy Support
The visual uses Hierarchical Layout mode, with rows driven by Financial Information.FS Level 4 as the parent and GL Information.FS Level 5 as the child. This gives users drill-down from P&L category to individual GL account.
Inforiver also provides native support for ragged/unbalanced hierarchies. In a typical financial statement, some accounts (such as IT Expenses or Other Expenses) have no child accounts, while others (such as Personnel Costs) are deeply nested. Native Power BI shows blank row headers under leaf-level parents, Inforiver hides them automatically.
In this report, the Add Back section is collapsed by default, relevant for EBITDA discussions, but not needed in every view. The data is always there; it simply does not dominate. This is configured directly in the visual through Inforiver’s row expand/collapse settings.
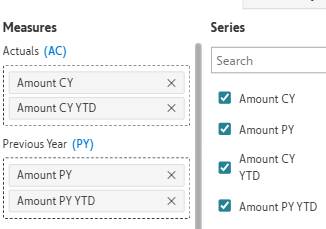
Smart Analysis: Time Intelligence Without DAX
Rather than building dozens of time intelligence measures in DAX (PY, YTD, PY YTD, TTM, MTD, QTD), Inforiver’s Smart Analysis automatically calculates and visualises variances between Actuals, Forecasts, Plans, and Prior Year, and applies the IBCS notation conventions (solid for actuals, hatched for forecasts, outlined for plans) automatically. Totals and subtotals are computed automatically based on the row hierarchy.
The semantic model only needs to provide the base measure and a properly configured Calendar table. Inforiver derives the rest at the visual level.
Row Reordering: No Sort Keys Required
Inforiver manages the P&L row order entirely within the visual, eliminating the need for sort key columns in the data model. Rows can be drag-and-dropped into the desired sequence (Revenue at the top, then COGS, Operating Expense, Other Income, Non-Operating Expense, Add Back, and so on) and the order is persisted with the visual.
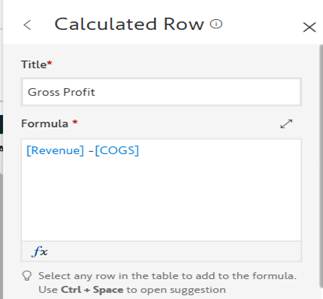
Calculated Rows: Excel Formulas Inside Power BI
Rows like Gross Profit, Operating Profit, and EBITDA do not need to be DAX measures, they can be inserted as calculated rows directly in the visual using an Excel-like formula editor with 80+ built-in functions. For example, a Gross Profit row would be inserted with a formula like:
| // Inforiver Formula Editor — Gross Profit calculated row |
| // Excel-like syntax in Inforiver’s formula editor [Revenue] – [COGS] |
The result is auditable, formatted, and editable by finance users without involving the developer team. Every change is captured in Inforiver’s audit log, preserving the traceability that auditors and controllers require.
IBCS Compliance
Inforiver Reporting Matrix is officially IBCS-certified (recertified July 2025). One-click templates automatically apply the IBCS notation system. For finance teams, this means:
- Solid bars for Actuals, hatched bars for Forecasts, outlined bars for Plans, and a distinct notation for Prior Year, applied automatically based on column role assignment
- Scale bands magnify smaller variances so they remain readable on charts dominated by large absolute numbers
- Pre-built T01, T02, T04 templates for variance reports, MTD/YTD/QTD comparisons, and calculation schemes typical of P&L and cash flow statements
| “Inforiver perfectly applies IBCS notation to its interactive and consumer-centric software. It feels like coming home.” Dr. Rolf Hichert, Member of the IBCS Certification Team |
Negative Sign Formatting and Traffic Light Theme
Each column in this report displays negative values with parentheses (x) rather than a minus sign, the standard accounting convention, set via Inforiver’s per-column negative sign formatting. Variance colouring uses Inforiver’s Traffic Lights theme: positive variances render in black (neutral, meeting budget is expected), while negative variances render in deep red.
In-Cell Charts and Visual Density
Inforiver supports embedded bar, bullet, waterfall, sparkline, and lollipop charts directly inside table cells, with auto-scaling aligned to IBCS standards. A variance column can show both the number and a small bar chart in the same cell.
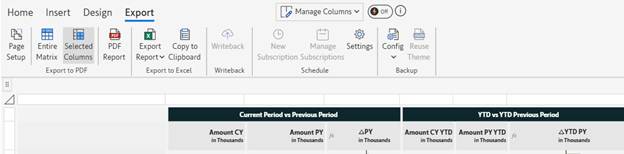
Quick Access Toolbar
The Inforiver visual exposes a purpose-built quick access toolbar with the icons that finance teams actually use daily: Excel export, undo, redo, best-fit, writeback, reset, and rails. PDF and Excel exports preserve formatting natively, with PDF exports being JSON-based rather than image-based, the output remains searchable and accessible.
Empty Column Suppression
The visual is configured to hide empty columns automatically, which means months with no data (future periods, or periods before the company’s fiscal year) automatically disappear from the view. This keeps the report clean without any manual filtering.
The Productivity Story: From Days to Hours
The combination of a properly engineered semantic model and Inforiver’s no-code reporting layer compounds in ways that are genuinely transformative for finance teams. According to Lumel’s own benchmarks:
- 20x faster financial statement creation versus native Power BI
- 5 minutes to build a moderately complex P&L statement
- Zero lines of DAX needed for variance calculations
These are vendor-published numbers, of course, your mileage will vary. But the principle is sound: the more presentation logic you push out of DAX and into Inforiver, the more agile your finance team becomes. Changes that previously required a developer ticket now happen directly in the visual, with a full audit trail.
Key Takeaways for Developers and Finance Teams
For Power BI Developers
- Build sign conventions into base measures, not the visualisation layer, they must be correct before Inforiver touches the data
- Resist the urge to pre-build PY / YTD / TTM measures in DAX. Inforiver’s Smart Analysis generates them automatically and consistently
- The _Measures table pattern + numbered display folders makes large financial models maintainable
- Use COALESCE(…, 0) on all financial measures to prevent blank propagation through subtotals
- Composable measures (EBITDA → Adjusted EBITDA) reduce duplication and make debugging easier
- TMDL version control in Git is essential for models of this complexity, every measure change is auditable
For Finance Teams and Analysts
- Inforiver provides row reordering, calculated subtotals, and formatting control that native Power BI cannot
- You can insert Gross Profit, EBITDA, or any calculated row using Excel-like formulas, no DAX required
- One-click IBCS templates apply professional finance notation automatically
- Excel and PDF exports preserve formatting: your offline review process does not need to change
- Traffic light colouring is intentional: red means over-budget or unfavourable, regardless of sign convention
- Cell-level comments with @-mentions and replies are available in Inforiver Enterprise for collaborative reviews
Reporting Matrix vs Writeback Matrix
This implementation uses the Inforiver Reporting Matrix, which is the right tool for analytical and management reporting. If the use case extends to collaborative budget entry (where finance team members input forecasts directly into Power BI and those values need to be persisted back to a database) the Inforiver Writeback Matrix adds that capability while retaining all the reporting features. Both support writebacks to Azure SQL, Microsoft Fabric Lakehouse, Snowflake, Databricks, Dataverse, and SharePoint.
Final Thoughts: Why This Architecture Works
The combination of a well-engineered Power BI semantic model and Inforiver’s presentation layer represents genuine progress for enterprise financial reporting. It is not a workaround or compromise. It is the right architecture for the problem.
The semantic model handles data integrity, business logic, sign conventions, and governance. Inforiver handles presentation, formatting, calculated rows, time intelligence at the visual layer, and the Excel-like experience that finance teams actually need.
The result is a financial reporting platform that a data engineer can maintain with confidence, a finance analyst can use without training, and an executive can read without squinting. Power BI with Inforiver clears that bar.
This approach has industry momentum. Lumel, the company behind Inforiver, entered a strategic first-party alliance with Microsoft in 2024 to launch Enterprise Planning in Microsoft Fabric. For organizations already invested in the Microsoft data platform (Fabric, Power BI, Azure SQL, Purview), Inforiver is no longer a third-party add-on bolted onto a Microsoft stack. It is increasingly part of the same conversation.
Building Financial Models for Your Organization?
The architecture in this article reflects how enterprise finance teams operate: separation of concerns between data integrity (DAX/semantic model) and presentation (visual layer). Whether you are scaling Power BI across divisions, consolidating reporting from multiple sources, or building month-end close automation, the principles apply.
Data Crafters works with finance and operations teams to design and implement production-grade financial models in Power BI and Microsoft Fabric. If you are evaluating Inforiver, scaling financial reporting, or need guidance on semantic model architecture for complex financial statements, reach out. We have built this pattern in production environments.
Further Reading & Watching
- Visual Formulas vs DAX with Marco Russo (panel discussion): videos.inforiver.com/reporting-matrix/expert-speak/visual-formulas-vs-dax-with-marco-russo
- A Proposal for Visual Calculations in DAX, Marco Russo, SQLBI: sqlbi.com/articles/a-proposal-for-visual-calculations-in-dax/
- Achieve 20x productivity in P&L / financial statement reporting in Power BI: inforiver.com/blog/financial-statements/financial-statement-power-bi/
- 8 challenges in creating P&L statements in Power BI: inforiver.com/blog/financial-statements/challenges-financial-income-statement-reporting-matrix-table-power-bi/
- 14 Financial Modeling Templates for Microsoft Power BI (Lumel eBook): lumel.com/ebooks/14-financial-modeling-templates-for-microsoft-power-bi/
- Building IBCS-compliant reports in Power BI (Inforiver eBook): inforiver.com/ebooks/building-ibcs-compliant-reports-power-bi/
- Inforiver formula reference: docs.inforiver.com
- IBCS certification of Inforiver: ibcs.com/software/inforiver/
- Inforiver YouTube channel: youtube.com/@Inforiverbi
- Lumel webinars: lumel.com/webinars/
| Inforiver version referenced: v3.3.9.1 (Inforiver Reporting Matrix, October 2025 release). Features and configuration options evolve with each release. Refer to docs.inforiver.com for the latest capabilities. |


