1. Introduction
As organizations scale their use of Microsoft Fabric, many teams start with Dataflow Gen2 due to its agility, ease of use, and quick setup. Dataflows are often an ideal tool for initial rapid development. However, as business data grows and becomes more complex, only relying on Dataflows can lead to performance bottlenecks, time consuming and rising costs. This blog explores how a hybrid approach combining lightweight Dataflows and SQL views can solve these issues, delivering a more scalable, cost-effective, and maintainable solution. In this blog, I will cover:
- The conversion of 100% usages of Dataflow solution into a Hybrid design.
- How to use Dataflows with SQL views for more efficient orchestration and computation.
- Real-world performance and cost benchmarks comparing the two approaches.
2. The Case for Dataflows
Dataflows are a powerful feature of Microsoft Fabric. They enable data transformation tasks such as joining tables, filtering data, and performing calculations in a no-code/low-code environment. This makes Dataflows an excellent starting point for both non-IT and IT professionals or any professionals. The idea was to build two dataflows:
- First Dataflow (Complete Dataflow): Using 100% transformation into a dataflow.
- Second Dataflow (Hybrid Dataflow): Using 20% transformation into a dataflow and 80% transformation using SQL queries.
In my scenario, I used the Sample Retail Dataset, which included 6 tables:
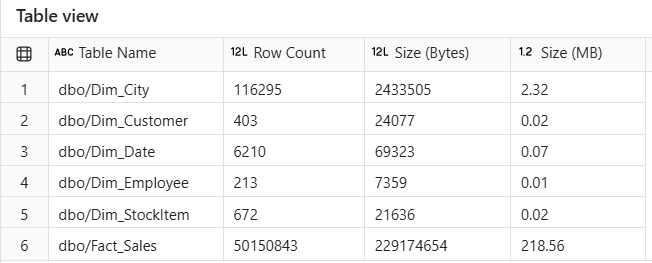
Figure 2.1: Tables Information from Sales_LH Lakehouse.
3. Challenges with a 100% Dataflow Approach
Although Dataflows work well for small datasets, they tend to have the following limitations as data volume grows:
- Performance Bottlenecks: As the number of joins and transformations increases, the refresh time becomes significantly longer.
- High Resource Consumption: Dataflows can consume excessive Fabric capacity (both CPU and memory), which drives up costs.
- Lack of Scalability: Dataflows can become difficult to manage and scale for larger datasets and production workloads.
- Limited Reusability and Governance: Complex transformations in Dataflows are often hard to audit, maintain, and reuse.
4. Implementation of 100% Dataflow Approach (Complete Dataflow)
I used 100% Dataflow for the initial approach. This method involved:
1. Sample Dataset:
Take all 6 views of tables from Sales_LH lakehouse which tables are the Sample Retail Dataset. Considering views because we often need near-real-time (NRT) data. By using views, the data will be updated when the source of the data is updated.
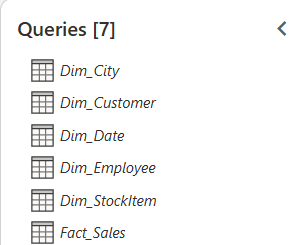
Figure 4.1: Views of Sales_LH tables.
2. Joining Between Tables:
Joins between multiple tables and produce a Sales_Full_DF flat table.
- Fact_Sales Dim_City on [CityKey]
- Fact_Sales Dim_Customer on [CustomerKey]
- Fact_Sales Dim_Employee on [SalespersonKey] = [EmployeeKey]
- Fact_Sales Dim_StockItem on [StockItemKey]
- Fact_Sales Dim_Date on [InvoiceDateKey] = [Date]
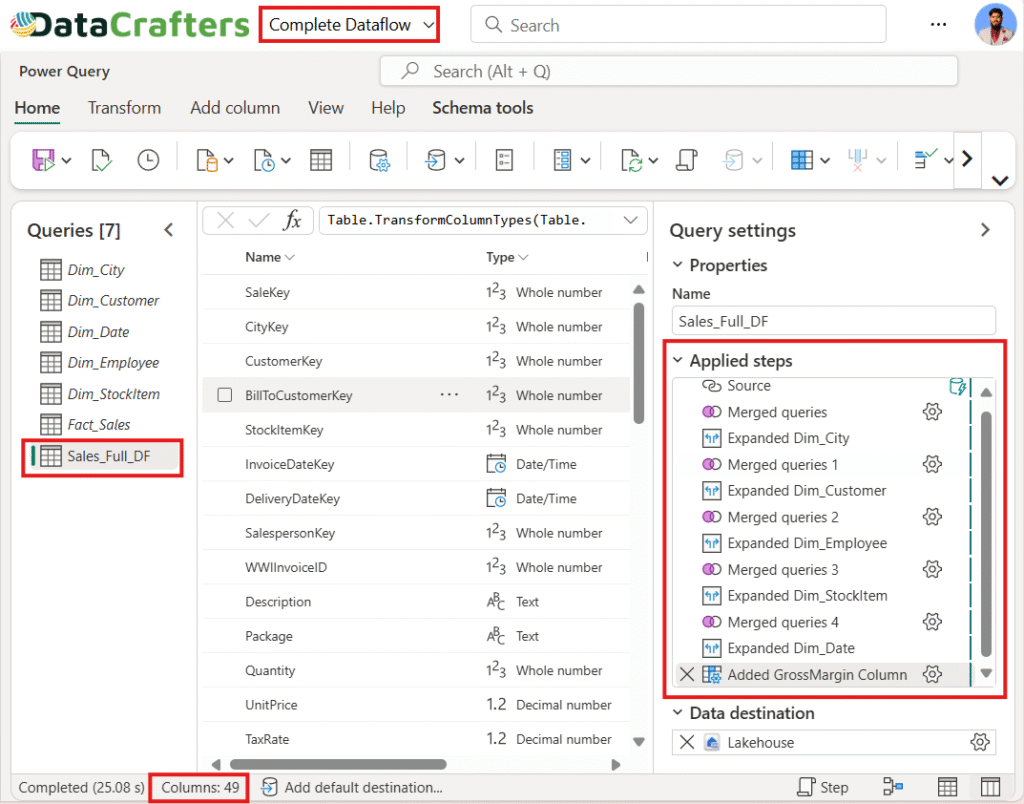
Figure 4.2: Complete Dataflow (100% use of Power Query).
3. Added Custom Column in Power Query:
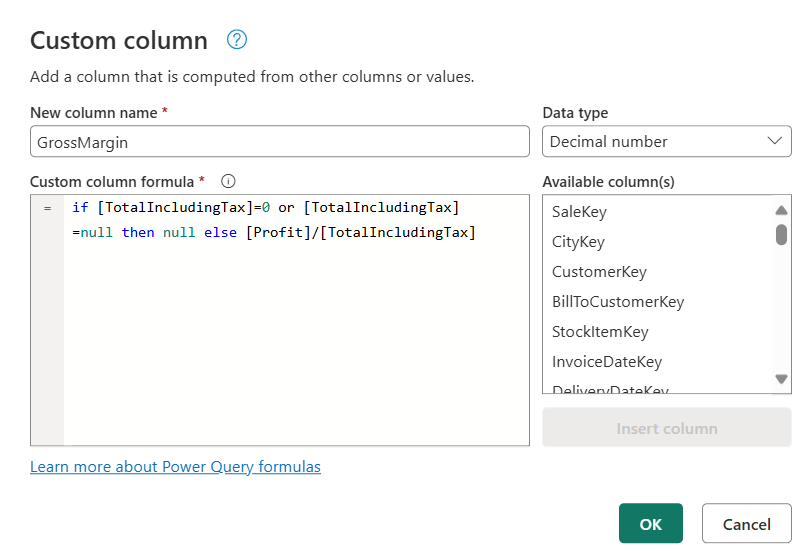
Figure 4.3: GrossMargin Custom Column Using Power Query.
4. Data Destination:
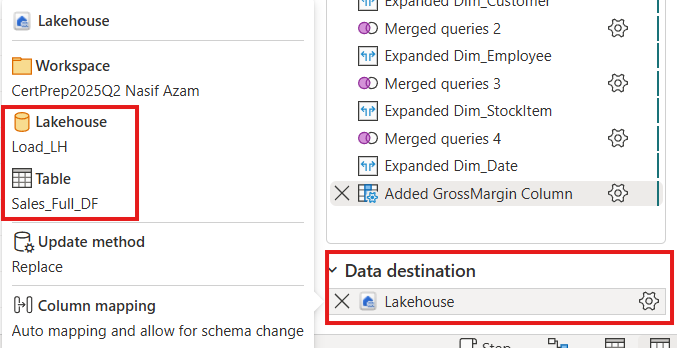
Figure 4.4: Load The Flat Table into Load_LH Lakehouse.
The output was a wide, enriched flat table (Sales_Full_DF), which was then loaded into another Lakehouse (Load_LH) to identify refresh time of the Sales_Full_DF. The flat table contains 49 columns and 50150843 rows.
5. Introducing the Hybrid Approach
To address the scalability and cost issues, we turned to Hybrid Design. In this approach we convert all joins transformations into T-SQL as a view namely Sales_Hybrid_DF then get the view into Hybrid Dataflow. Added a custom column into the Hybrid Dataflow using power query (M Code). Finally load the table into Load_LH.
6. Implementation of Hybrid Approach (Hybrid Dataflow):
1. Transform Joins in SQL View:
Convert all complex transformations of joins into T-SQL. The transformation part saves as a view inside the Sales_LH lakehouse as Sales_Hybrid_DF.
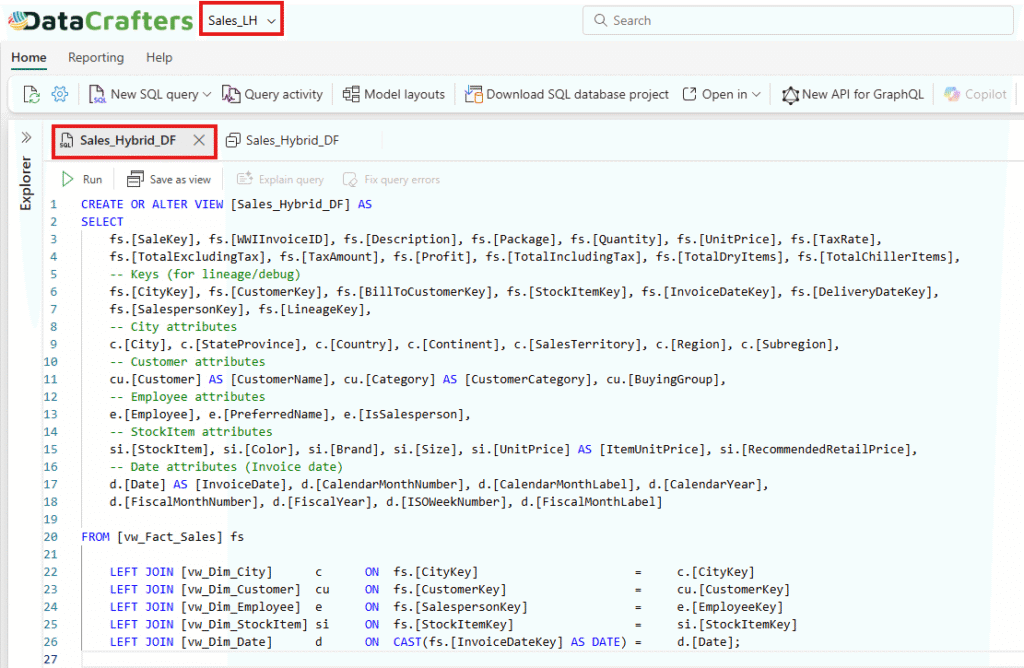
Figure 6.1: T-SQL Query.
2. Bring the SQL View into Hybrid Dataflow:
Connect the Hybrid Dataflow to the Sales_Hybrid_DF SQL view. This minimizes heavy processing in Power Query and leverages the underlying engine’s performance.
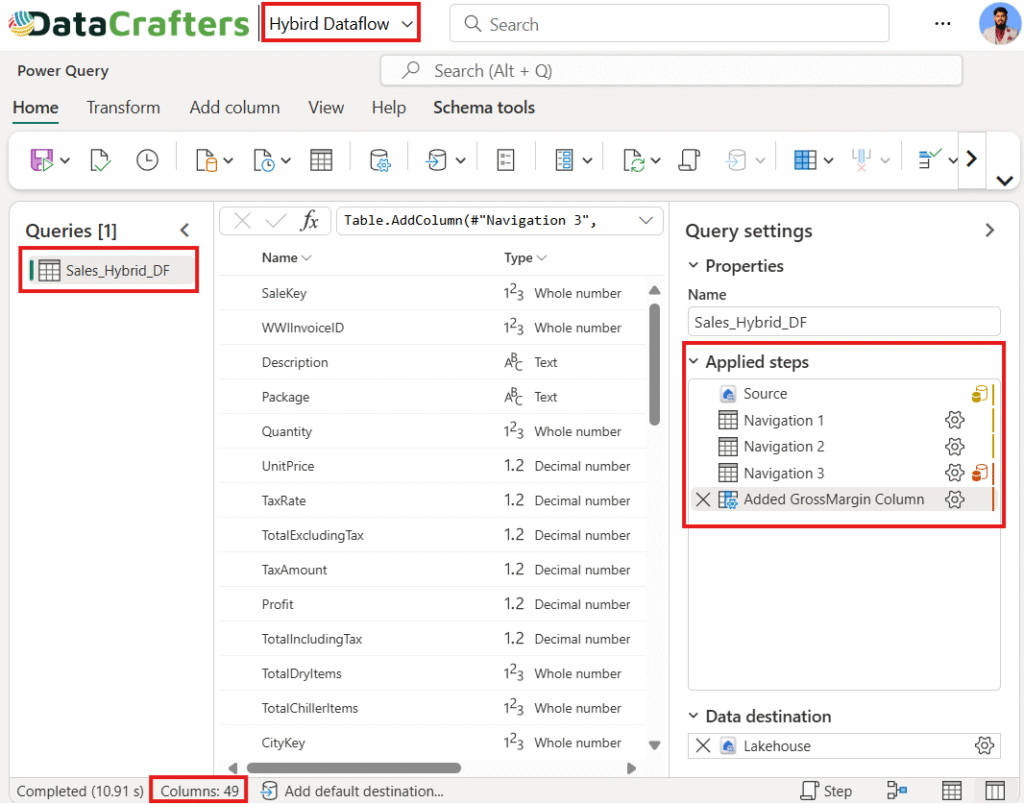
Figure 6.2: Hybrid Dataflow (80% use of T-SQL).
3. Added Custom Column in Power Query:
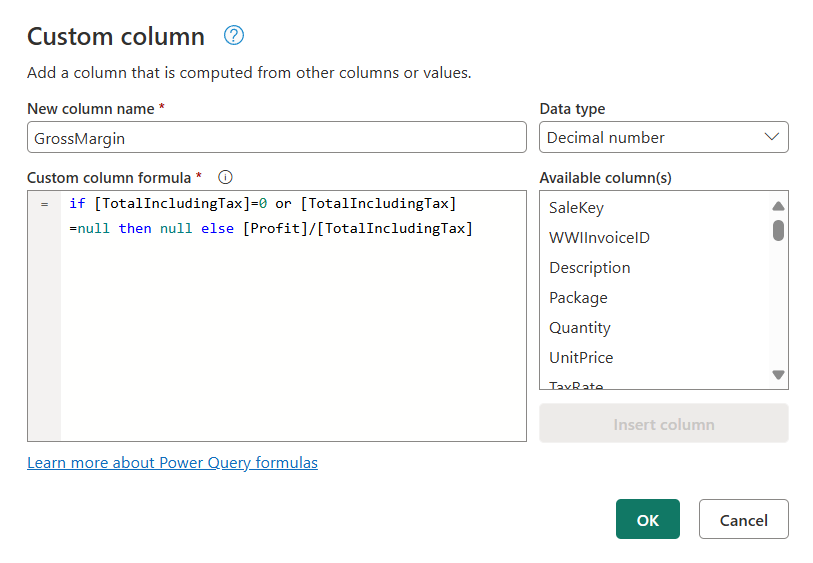
Figure 6.3: GrossMargin Custom Column Using Power Query.
4. Data Destination:
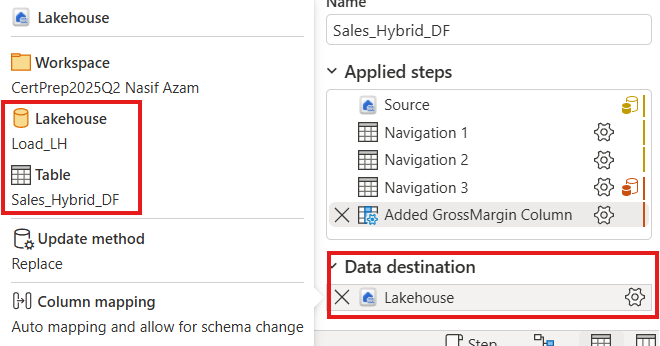
Figure 6.4: Load The Flat Table into Load_LH Lakehouse.
The output was a wide, enriched flat table (Sales_Hybrid_DF), which was then loaded into another Lakehouse (Load_LH) to identify refresh time of the Sales_Hybrid_DF. The flat table contains 49 columns and 50150843 rows.
7. Performance and Cost Benchmarking
One of the most compelling reasons to adopt a Hybrid approach is its cost-effectiveness, less storage and performance improvements. Let’s look at the comparison between the two approaches.
1. Testing Methodology
- Built the baseline 100% Dataflow approach using Dataflow Gen2 (Sales_Full_DF). All transformations are done in the dataflow.
- Rebuild the solution using a Hybrid approach with SQL views for heavy transformations and custom column using dataflow (Sales_Hybrid_DF). So that 80% of transformations like joining happens in T-SQL and 20% transformations like custom column done in dataflow using power query.
- Measured the refresh time, resource consumption, and fabric cost for both approaches using Fabric’s Capacity Metrics App and refresh history.
2. Results of Table View:
In this figure, it is evident that both approaches load an equal number of rows and columns. However, it is important to note that the Hybrid Dataflow approach slightly reduces the overall size of the flat table. This reduction becomes even more pronounced as the size of the table increases.
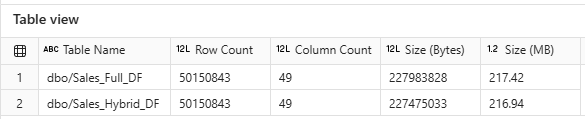
Figure 8.2: Both Approaches Table Information.
3. Results of Fabric Monitor
In this figure, we compare the refreshing times of both the hybrid and complete dataflow approaches. The hybrid approach demonstrates a clear advantage, completing the refresh 13 minutes and 56 seconds faster than the complete approach, where all transformations are performed within Power Query. Notably, as the size of the dataflow increases, the hybrid approach performs better than the complete approach.
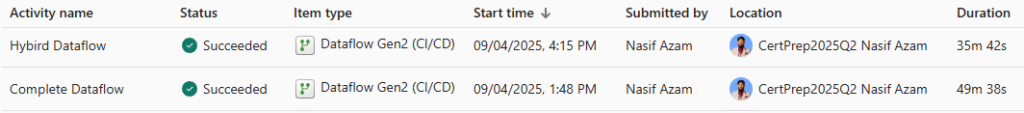
Figure 8.3: Both Approaches Table Information.
4. Results of Fabric Capacity Metrics App
1) Capacity Unit Consumption in Second
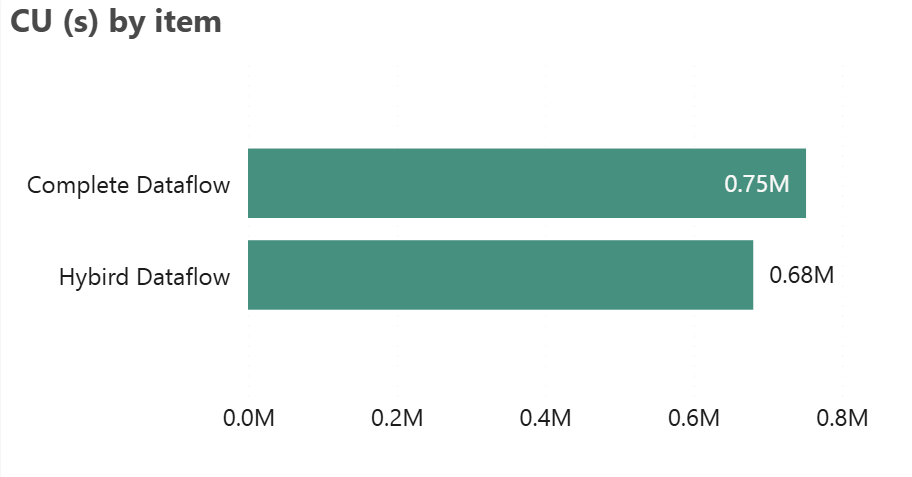
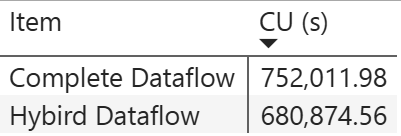
Figure 8.4.1: Capacity Unit (CU) Consumption.
Compare the “Complete Dataflow” and “Hybrid Dataflow” based on CU (s) usage. The bar chart visually indicates that Complete Dataflow consumes more resources compared to Hybrid Dataflow. Despite this, the “Hybrid Dataflow” is technically performing better, as it consumes fewer CU(s), meaning it is more efficient in terms of resource usage. Therefore, Hybrid Dataflow is the better-performing option, as it uses less capacity for similar tasks.
2) Workspace Details by % Compute
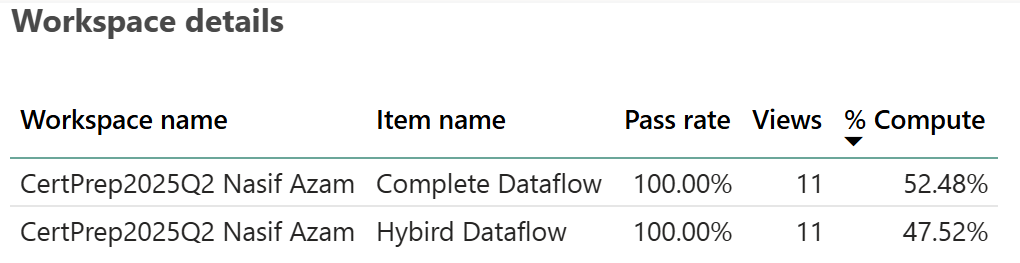
Figure 8.4.2: Computation Resources.
Both have a 100% pass rate, meaning all tests or processes related to them have been successful. However, the key difference lies in the “% Compute” column. “Complete Dataflow” utilizes slightly more computing resources (52.48%) compared to the “Hybrid Dataflow,” which uses 47.52%. Based on this information, the “Complete Dataflow” is using more computer resources, which might suggest it is handling more intensive processing tasks.
3) Item Details
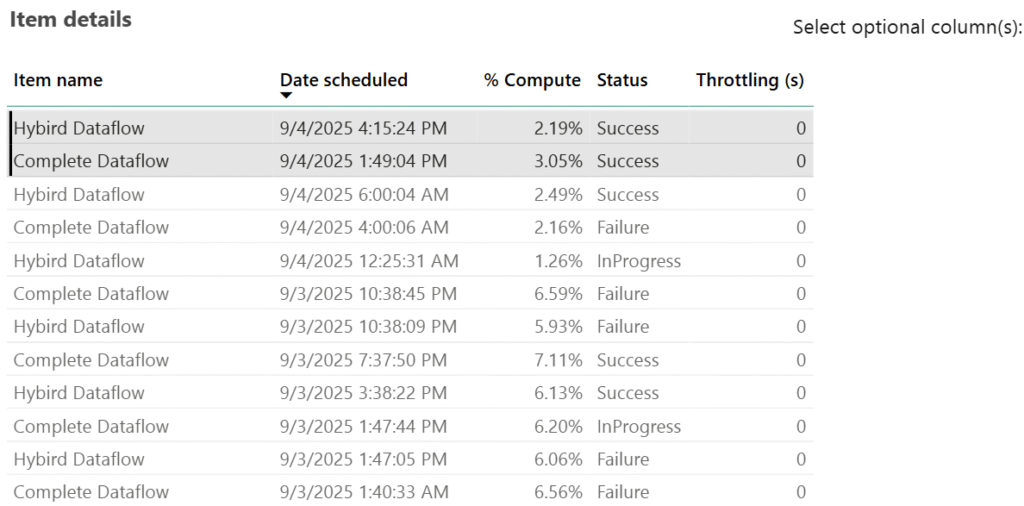
Figure 8.4.3: Granular Level Item Details.
Hybrid Dataflow uses lower compute percentages (2.19%), indicating better efficiency and reliability. Complete Dataflow, on the other hand, consumes higher computing (3.05%) which is heavier on resources and less stable. Overall, Hybrid Dataflow performs better in efficiency, while Complete Dataflow is more resource-intensive but less reliable.
8. Why Adopt a Hybrid Approach:
- Cost Optimization: Offloading heavy operations to SQL reduces resource consumption, resulting in lower Fabric capacity costs.
- Enhanced Performance: The hybrid model shortens refresh times, ensuring faster and more responsive reporting.
- Time & Storage Efficiency: Compared to a complete dataflow [see Fig. 7.3], the hybrid approach consumes less time and storage.
- Better Experience: Improved performance and faster report rendering create a more efficient and user-friendly reporting experience.
- Direct Access to Tables: In many cases, higher authorities request raw tables rather than views, as views are simply metadata representations.
- Maintainability & Governance: SQL views provide a centralized layer that is easier to manage, audit, and reuse across multiple dataflows and reports.
- Scalability: A hybrid design is better equipped to manage growing data volumes compared to a purely visual, dataflow-driven approach.
- Flexible Scheduling: Dataflow Gen2 enables scheduled or near real-time refreshes with ease.
- Resilience with Pipelines: Failed refreshes can be automatically retried using pipelines, reducing downtime and manual intervention.
9. Conclusion
The Hybrid Design in Microsoft Fabric strikes the perfect balance between agility and scalability. By starting with Dataflows for quick implementation and then gradually migrating heavy logic to SQL views, organizations can avoid the common pitfalls of high costs and poor performance as data scales.
10. The Good News!
The latest updates for Dataflow Gen2 (September 2025) introduce two major performance and cost optimizations:
1. Partitioned Compute (Preview):
Automatically splits large dataflows into parallel partitions, executing them concurrently using SQL engines instead of the Mashup engine.
- Performance Impact: In internal benchmarks, loading 12 Parquet files of sample data (NYC taxi data) dropped from 1.5 hours to under 25 minutes.
- Cost Impact: Since Lakehouse/Warehouse compute uses 6 CU/s where mashup take 16 CU/s.
2. Modern Evaluator (Preview):
A .NET Core–based query engine that replaces the legacy Mashup engine for supported connectors.
- Performance Impact: Expect faster query evaluation and more efficient resource utilization for sources like Azure Blob, ADLS Gen2, Fabric Lakehouse, OData, and SharePoint.
- Cost Impact: By reducing refresh time, it lowers the compute units because Dataflow Gen2 pricing is based on query execution duration multiplied by the CU rate.
Together, these enhancements reduce run times by up to 8 times and lower CU/s consumption by up to 3 times compared to the pre-updated Dataflow Gen2. The combined effect of these updates means enterprise teams can now process exponentially larger datasets with good performance and lower costs.
3. Pre-Update Dataflows Gen2 vs. Latest-Updated Dataflow Gen2
| Aspect | Old Dataflow Gen2 | New Dataflow Gen2 |
|---|---|---|
| Query Execution Engine | Mashup only (16 CU/s) | Mashup or Modern Evaluator (16 CU/s → faster) |
| Large Data Handling | Sequential processing | Partitioned Compute (parallel, 6 CU/s) |
| Typical Load Example | 1.5 h run time | < 25 min run time |
| Cost for Example | (1.5 h x 16 CU/s) = 86,400 CU-s (~$4.32) | (25 min x 6 CU/s) = 9,000 CU-s (~$0.45) |
| Ingestion Speed | Baseline | 8× faster with Fast Copy |
| Cost Efficiency | Baseline | 3× lower cost with Fast Copy |