Which tasks are running late, and what is waiting on them? A bar chart of task durations cannot answer that. It shows how long each task takes, but not when it starts, what it overlaps, or what must finish before the next one can begin. A Gantt chart places every task on a calendar instead. Each bar starts at its start date and ends at its end date, so overlaps, gaps and slips show up without any arithmetic.
Power BI added a native Gantt visual in October 2026, still in preview. The Intelligence Sheet has one in its visual library.
Both read from Power BI semantic models. The difference is context: whether the schedule is a snapshot of the last data load, or a plan that people are still editing. The running example is a delivery project in three phases, Requirements, Design and Development, with planned dates, actual dates and a progress value on every task.
Watch It in Action
Power BI: Gantt Chart (Preview)
Power BI’s native Gantt visual sits in the Visualizations pane like any other visual. Only the label for each row is required. Start and End place the bars, a measure for percentage complete shades the progress on each one, and up to three category levels group the tasks. Columns add details such as owner or status beside the task list, and tooltip fields add more context without taking up space. A milestone is drawn when End is blank, so a milestone row needs a start date and an End measure that returns blank for it.
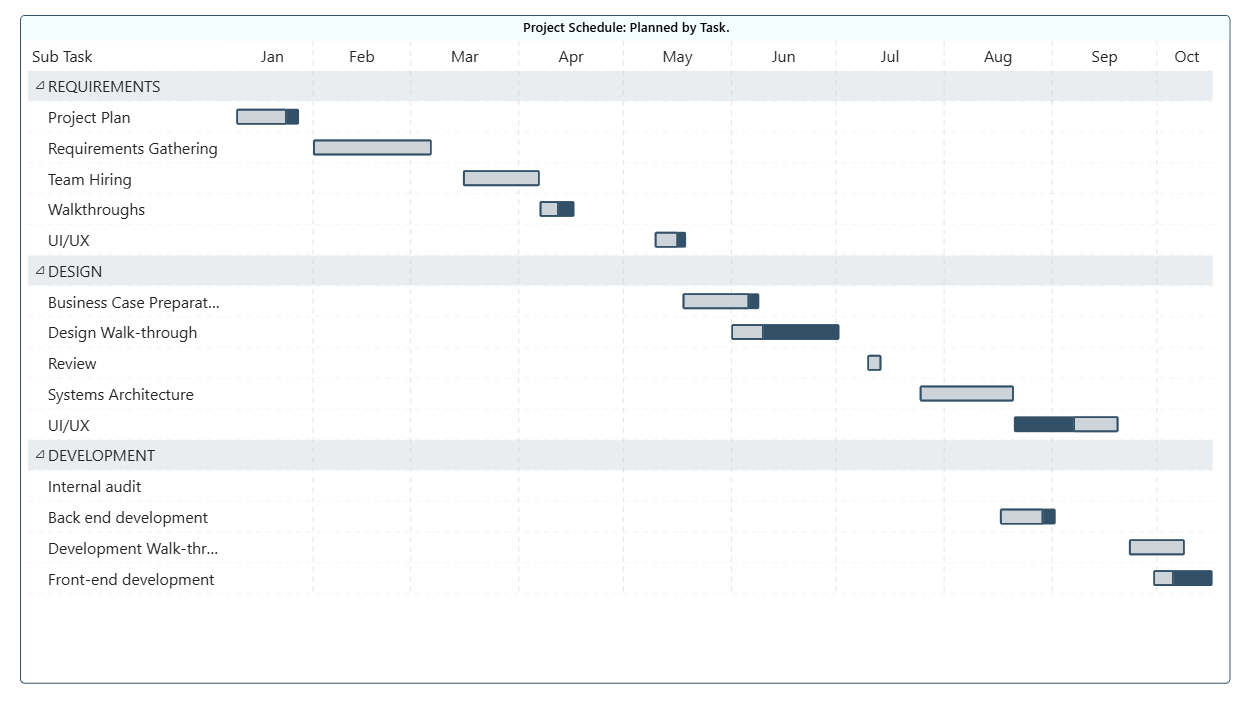
Below, Project Schedule: Planned by Task groups fourteen tasks under the three phases, January to October. Each phase is a shaded band with its tasks beneath it, and the progress shading inside each bar shows how far that task has come. Internal audit has no bar yet, because it has no dates.
The format pane controls the rest. One color set under Rows cascades to categories, bars, milestones and row backgrounds, with each category level a little lighter than the one above. Progress can show as a transparent overlay or as a fill inside a bordered bar. The axis can scale itself between years, months and days, or hold two fixed levels such as months over years. Weekends or any other days can be shaded, and readers can zoom into a window of the timeline and return to the full range.
A note on the native Gantt
For a schedule with grouping, progress and a few detail columns, the native visual covers the common ground, and it reads from the semantic model like every other native visual. It is in preview, and Microsoft documents a limit of 1,000 rows.
Its wells are Task row, Start, End, Progress, Category, Columns and Tooltips. There is no field for a planned baseline and none for task dependencies. A bar cannot show how far it slipped against plan, and nothing draws an arrow from one task to the next. The chart above plots the planned dates only, because the visual takes one pair of dates. If the model has implicit measures turned off, Start, End and progress each need an explicit measure, and Microsoft notes that a measure display format may not carry into tooltips or columns, with Data format on the General tab as the workaround.
Before this visual, the usual route was the Gantt custom visual Microsoft publishes on AppSource, which has the same two gaps. Both show the schedule as it stood when the model last refreshed.
Gantt Charts in the Intelligence Sheet
The Intelligence Sheet reads from the same Power BI semantic models your existing reports use, and carries the Gantt as a visual in its library. There is nothing to import and no preview flag to check. The same sheet can also blend in planning sheets, PowerTable sheets and uploaded files from the same Plan item, which is what lets a schedule sit next to the plan it belongs to.
The wells describe the chart before you bind anything. Task and Start date are required. End date or Duration sets the length of each bar, Progress shades the completed share, and Planned start date and Planned end date add the baseline. Milestone marks key dates, Connect to, Connector type and Connector id draw the dependencies, and the data label, tooltip and drill-through wells finish the set.
Gantt
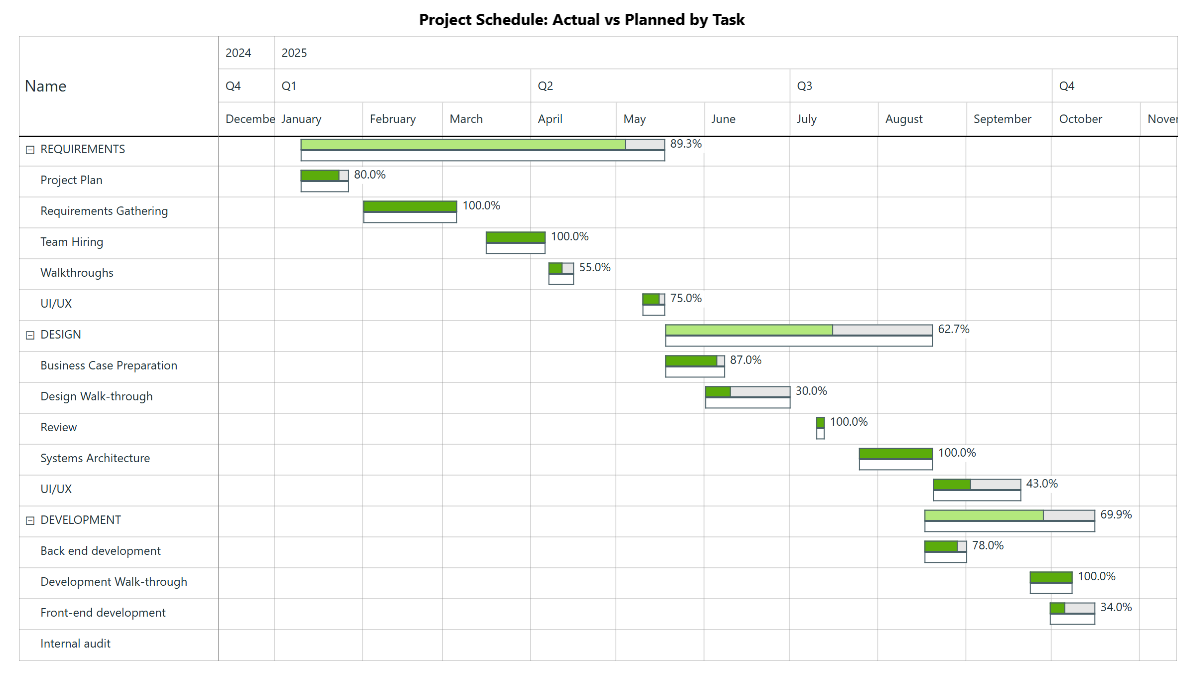
The Intelligence Sheet Gantt covers, in one visual, the two things the native Gantt leaves out. Each phase rolls its tasks up into a parent bar that collapses and expands from the drill-down icon, and every bar prints its own completion. Below, Requirements stands at 89.3%, Design at 62.7% and Development at 69.9%. The outlined bar under each task is the plan, so a task running past its planned dates shows as the gap between the two bars rather than as a number in a tooltip.
The task rows carry the detail. Requirements Gathering and Team Hiring are complete, while Walkthroughs sits at 55% and Design Walk-through at 30%. Internal audit has no bar here either, which is worth seeing on a delivery review: a task on the list with no dates against it.
Milestones render as diamond markers on the timeline, and dependencies render as connector lines whose color, style and arrowheads are set in the Connector section. From References > Analytics, a Today line splits the chart into what is overdue and what is still ahead, and reference bands can mark a sprint or a phase. The timeline header has its own levels, year, quarter and month here, and zooms down to days.
Built for the Planning Workflow
Because this Gantt sits on your Power BI semantic model, it works on the schedule you already report on today. It goes further when that model is paired with a plan. Consider a program office running a data platform delivery with a finance partner. The schedule and the budget are linked: each phase releases spend, and each milestone triggers a payment or a sign-off. The program manager needs dates, progress and owners on one screen. Finance needs to see what a slipped date does to the spend profile.
In most reporting builds, that schedule is fixed. When a date moves, someone updates the project tool, waits for the next refresh and checks that the chart caught up. The people who own the dates are not the people who own the report, and the chart lags between them. The native Gantt shares that limit, because it cannot take input from a plan, and without a baseline it cannot show the slip either.
When the schedule is read from a live plan instead, that wait goes away. Embed a planning sheet in the Intelligence Sheet and its measures appear under From Sheets in the Data pane. Microsoft Learn describes changes in that sheet flowing through to charts and KPI cards without a batch refresh. The planned and actual bars show the slip against the baseline, the Today line shows what is overdue, and a planning measure such as a phase budget sits on the same canvas as a KPI card beside the schedule.
That changes what the delivery review is about. Finance and the program office read the same chart, so the conversation moves from whose dates are current to which slip needs money moved.
When to Reach for Which
| If your report needs… | Reach for… |
|---|---|
| A simple task schedule with grouping and progress, from the semantic model | Power BI Gantt (preview) |
| Owner, status or duration columns beside the bars, with weekend shading | Power BI Gantt (preview) |
| A task hierarchy with planned baselines and dependency connectors | Intelligence Sheet Gantt |
| Milestones, a Today line and zoom from year to day in one view | Intelligence Sheet Gantt |
| Dates the team edits in a plan and sees reflected on the chart | Intelligence Sheet Gantt with a planning sheet |
For a quick look at a task list that already sits in a semantic model, the native Gantt is the right starting point. It is in preview, so check that it is available in your tenant and Desktop version before you promise it to a report. If you only need the bars, the grouping and the progress, it is enough.
For a delivery review where dates move, dependencies matter and finance is watching the same schedule, the Intelligence Sheet is the fit: baseline, dependencies and milestones in one visual, on the same semantic model, with the plan beside it.
Getting Started: Gantt Charts in Fabric Intelligence
In the Intelligence Sheet, add the Gantt visual and connect it to your Power BI semantic model, the same model your Power BI reports already use. Assign your task dimensions to Task in hierarchy order, so the phase comes before the task, then assign Start date and End date. Add a measure for Progress and, if you track milestones, a measure for Milestone.
The setting worth trying first is the baseline. Bind Planned start date and Planned end date, and every bar gains the outline that shows how far it has drifted from plan. That is the one thing the native Gantt does not draw. After that, assign the following task to Connect to and pick a Connector type to draw the dependencies, then add a Today reference line from References > Analytics. Gantt Options > Data colors sets the completed and pending colors, and Gantt Options > Timeline sets the header levels and date formats.
What’s Next
Episode 16 moves from time to flow: the Sankey diagram, where revenue splits and merges as it moves through the business.
Resources
- Plan in Microsoft Fabric IQ (Microsoft Learn): official documentation and getting started guides
- Visualize simulations, budgets, and forecasts (Microsoft Learn): how the Intelligence Sheet updates when planning sheet values change
- Gantt visual in Power BI, preview (Microsoft Learn): the native Gantt visual’s fields, formatting, axis and limits
- Monitor project progress with Gantt charts (Fabric Plan documentation): the Intelligence Sheet Gantt’s data wells, references, zoom levels and formatting
- Lumel Intelligence: the Lumel product page and three-pillar architecture overview
- Foundation, Part 1: Introducing the Intelligence Sheet: where Plan sits within Fabric IQ
- Foundation, Part 2: Inside the Intelligence Sheet Canvas: the visual library, data architecture, and series index