Which category is in the lead at each point in time, and when does the lead change hands? A ranked stacked column tells you the composition of a single period, but it does not tell you whether the category on top this month was also on top last month, or whether two categories crossed over somewhere in between. The ribbon chart answers that connecting each category’s stacked segment across periods with a twisting band, so a lead change shows up as a visible crossing rather than something the reader has to reconstruct period by period. Power BI ships this as a single native Ribbon Chart. The Intelligence Sheet carries the same idea into two orientations, Ribbon Column and Ribbon Bar, built for different volumes of categories and time periods.
Both read from Power BI semantic models. The difference is context: whether the ranking stops at the last actual period or extends forward to where the plan currently places it.
Watch It in Action
Power BI: Ribbon Chart
Power BI’s native Ribbon Chart plots a category field, a time field on the axis, and a measure. Each period renders a stacked column with categories ordered top to bottom by value, and a ribbon connects each category segment from one period to the next, twisting wherever two categories swap rank. Below, Yearly Sales by Month & Category shows twelve months of product subcategory sales: one subcategory holds the top band all year, so the movement worth watching sits a rank below it, where two subcategories trade second place and back again as the year runs on.
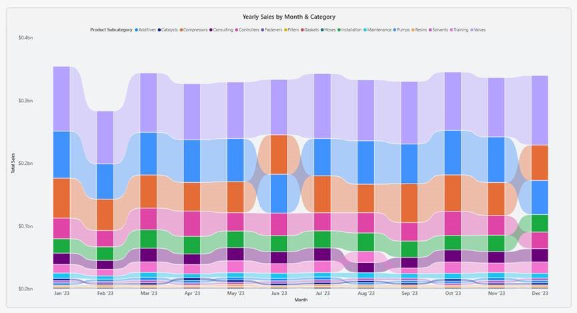
The visual reorders the ranking automatically every period, so no manual sort or rank measure is required. It reads directly from the semantic model like any other native visual and integrates with the standard Power BI interactions: slicers, tooltips, cross filtering, and drill through all work as expected.
A note on native ribbon charts
The native Ribbon Chart is a single, fixed orientation: categories stack vertically; time runs left to right. That works well for a modest number of categories over a modest number of periods, but it has not built in switch for a horizontal read, and it does not print value labels on the ribbon segments by default, so a reader wanting the exact number behind a band has to hover for a tooltip. Once the time axis stretches to two years of months, or the category list grows past what a legend can comfortably show, the vertical layout gets visually busy fast.
Two documented limits put numbers on that. The legend series is capped at the top 60 categories when the axis runs categorically, and the top 20 when it runs on a continuous scale, with the axis itself loading 500 rows at a time, so a long category list is trimmed rather than scrolled. The Analytics pane is unusually thin here as well: a ribbon accepts an X axis and a Y axis constant line and nothing further, with no trend line and no Forecast, which remains a line chart feature. Small multiples do not extend to the ribbon either, so comparing the same rank of race across regions means one visual per region. And the highest value is always drawn on top, which is the point of the chart, but also fixed, with no inverted read. For a straightforward rank over time story with a handful of categories, the native visual is the right starting point; past that, the Intelligence Sheet’s two orientations carry it further.
Ribbon Chart in the Intelligence Sheet
The Intelligence Sheet reads from the same Power BI semantic models your existing reports use and builds this ribbon family on top of them. Rather than one fixed orientation, it offers two purpose-built variants, Ribbon Column and Ribbon Bar, reading the same category, time, and value fields but laid out for different reading conditions.
Ribbon Column
The Ribbon Column variant mirrors the native chart vertical orientation; categories stacked per period with ribbons connecting them across time but adds direct value labelling on every segment. Below, each subcategory’s monthly value is printed on its band, so the reader sees both the rank crossing and the number behind it without a tooltip hover.
Ribbon Bar
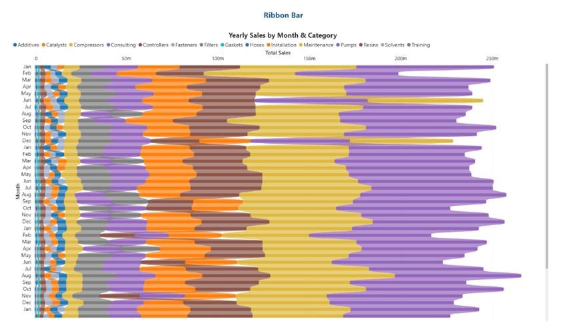
The Ribbon Bar variant rotates the same read onto a horizontal axis: time runs down the rows, value runs left to right, and the ribbons flow horizontally between rows instead of vertically between columns. Below, several years of months are stacked as horizontal rows, each with the same category of ribbons flowing across. That orientation is the more readable one once the time axis grows long, since a run of monthly rows on that scale is well past what a vertical column layout holds without heavy scrolling, and it keeps long category labels legible without truncation.
| Variant | Reads | Best for |
| Ribbon Column | Categories stacked per period, ribbons flowing across time, left to right | A modest time range, native style vertical read with labelled values |
| Ribbon Bar | Categories stacked per row, ribbons flowing across time, top to bottom | A long-time range or many categories, where a horizontal layout scales better |
These sit alongside the broader three source architecture behind the Intelligence Sheet, semantic models, Planning Worksheets, and Data Apps, so the same ribbon that reads a governed model today can be re-pointed at a live plan without a rebuild.
Planning Workflow: Rank Changes Before Actuals Confirm
Because these ribbon charts sit on your Power BI semantic model, they work on the data you already report on today. Monthly subcategory sales, regional leadership by quarter, channel rank over a rolling year: all that comes straight from the model your existing reports already use. Where they go further is when that model is paired with a plan.
Consider a category management review where leadership wants to know not just which product subcategory is leading sales this month, but whether that lead is expected to hold against the forecast for the rest of the year. A ribbon built on actuals alone shows the rank history up to today, but it stops at the last actual period. Connect the same ribbon to a Planning Worksheet, and the ranking can extend into forecast periods, so a category projected to overtake the current leader shows up as an upcoming crossing rather than a surprise once the actual data lands next quarter. That means category managers can plan promotional or inventory shifts around a leadership change before it happens, not after. A ribbon tied to the plan can show a rank change coming before actuals confirm it; one built against actuals alone can only show the rank change after it has already happened.
When to Reach for Which
| If your report needs… | Reach for… |
| A quick rank over time read for a handful of categories and periods | Power BI Ribbon Chart |
| A standard vertical stacked and ranked view straight from the semantic model | Power BI Ribbon Chart |
| Value labelled ribbon segments for management decks | Intelligence Sheet Ribbon Column |
| A long-time range or a large category list that needs a horizontal layout | Intelligence Sheet Ribbon Bar |
| A ranking that extends into forecast periods tied to a live plan | Intelligence Sheet Ribbon Column/Bar |
For a fast, ad hoc look at which category leads over a short time span, Power BI’s native Ribbon Chart is the right starting point: it reads the semantic model directly and needs no additional setup.
For management reporting or planning connected reviews, the Intelligence Sheet family is the better fit. It builds the same semantic model but adds direct value labelling, an orientation built for longer time ranges and larger category lists, and, when it matters most, a ranking that can extend forward with the plan rather than stopping at the last actual.
Getting Started: Ribbon Charts in Fabric Intelligence
In the Intelligence Sheet, add a Ribbon visual and connect it to your Power BI semantic model, the same model your Power BI reports already use. Assign your category, time, and value fields, then switch orientation between Ribbon Column and Ribbon Bar without rebuilding the field configuration.
The visual supports orientation switching and automatic rank ordering every period, with category crossings rendered as visible ribbon twists and no manual sort or rank measure required. Direct value labelling means segment values render on the ribbon itself, reducing the need for tooltip hovers in management decks. When you connect to Planning Worksheets, the ribbon can extend into forecast periods sourced from your plan, so an upcoming leadership change is visible before the actuals confirm it.
What’s Next
Episode 15 steps away from the native chart catalog for an audience driven detour: reach out with the visual you’d like covered next before the series resumes its regular march.
Resources
- Plan in Microsoft Fabric IQ Microsoft Learn: official documentation and getting started guides
- Visualize simulations, budgets, and forecasts Microsoft Learn: how the Intelligence Sheet updates in real time when planning sheet values change
- Lumel Intelligence: the Lumel product page and three pillar architecture overviews
- Foundation Part 1: Introducing the Intelligence Sheet: where Plan sits within Fabric IQ
- Foundation Part 2: Inside the Intelligence Sheet Canvas: the visual library, data architecture, and series index