
Financial forecasting helps businesses make smart decisions, plan budgets, and stay flexible in a changing market. But many finance teams still use basic spreadsheets to manage their forecasts, which creates problems like scattered data, lots of manual work, and poor visibility across the company.
Today, Power BI offers several planning tools for forecasting and budgeting, including Acterys, Aimplan, deFacto Global, Inforiver by Lumel Technologies, and Power On by InsightSoftware. For a detailed comparison of these tools, check out the comprehensive Planning Guide for Power BI written by Khaled Chowdhury and Paul Barnhurst here .
As Data Crafters is the partner of Lumel Technologies, we’ll guide you through using Inforiver to transform your budget and forecast planning from complex to effortless.
Inforiver changes this by bringing Excel’s familiar feel directly into Power BI. With the Inforiver Writeback Matrix, you can easily enter, change, and track forecast data in an interactive way. Then you can save it back to your Microsoft Fabric Lakehouse/Warehouse. This approach creates a single, trusted source of data for both reports and planning, eliminating the risks and extra work that come from using separate spreadsheet files.
What You’ll Learn
This guide will show you how to:
- Set up forecast scenarios in Inforiver within Power BI
- Enter and manage forecast data using simple grid tools.
- Send forecast data back to your Lakehouse for company-wide use and tracking.
Real Example
We’ll show you these features using a simple operating expense forecasting example. This will help finance teams understand how to improve their planning process while keeping the spreadsheet-like experience they’re used to.
This approach combines familiar tools with powerful data management, helping finance teams grow their forecasting abilities without losing the ease of use they need.
Let’s begin with a simple Operational Expense report for 2023 and 2024. Assume you have a table like below, and your goal is to forecast values for 2025.
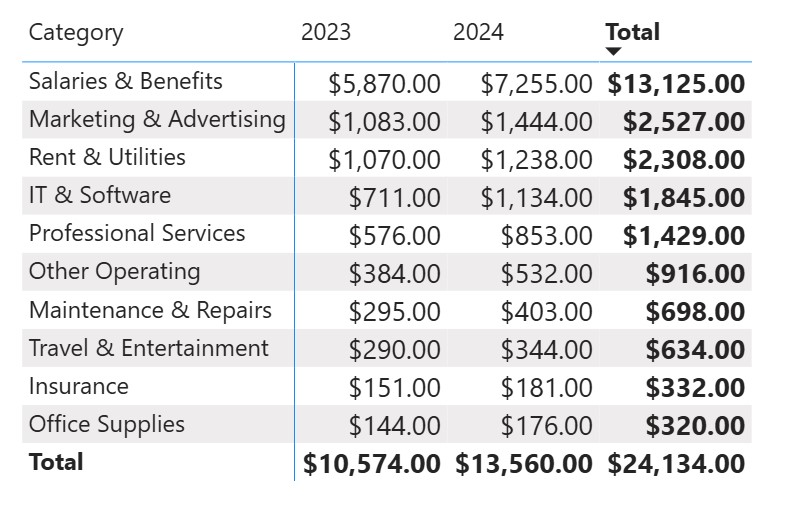
Example: Opex Amount by Category for 2023 & 2024
Step 1: Add Inforiver Writeback Matrix to Your Report
- Go to a blank report page in Power BI.
- If you already have the Inforiver Writeback Matrix in your visual pane, simply select it.
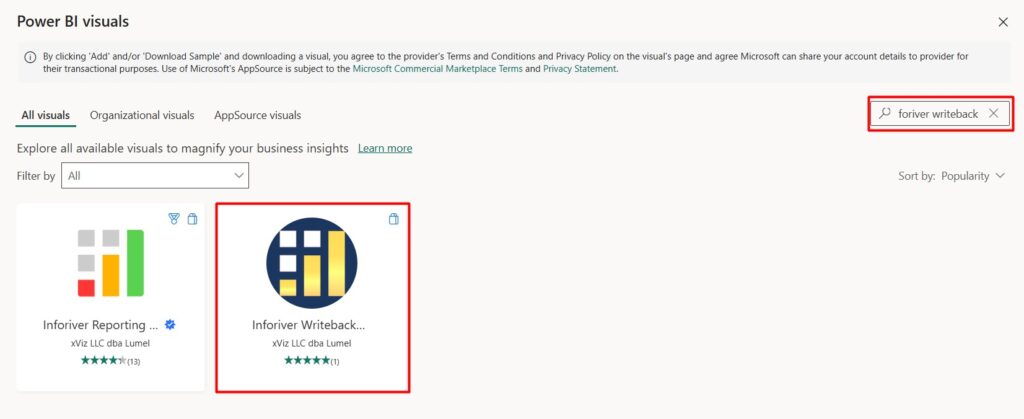
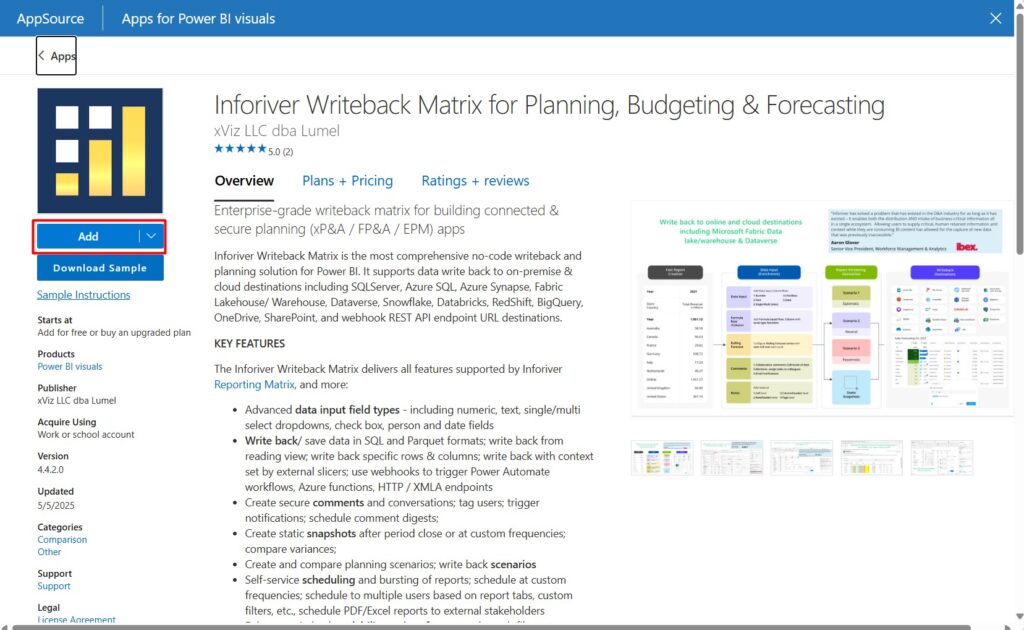
- If not, click “Get more visuals” and search for Inforiver Writeback Matrix.
- Click “Add” to make it available in your visualizations pane.

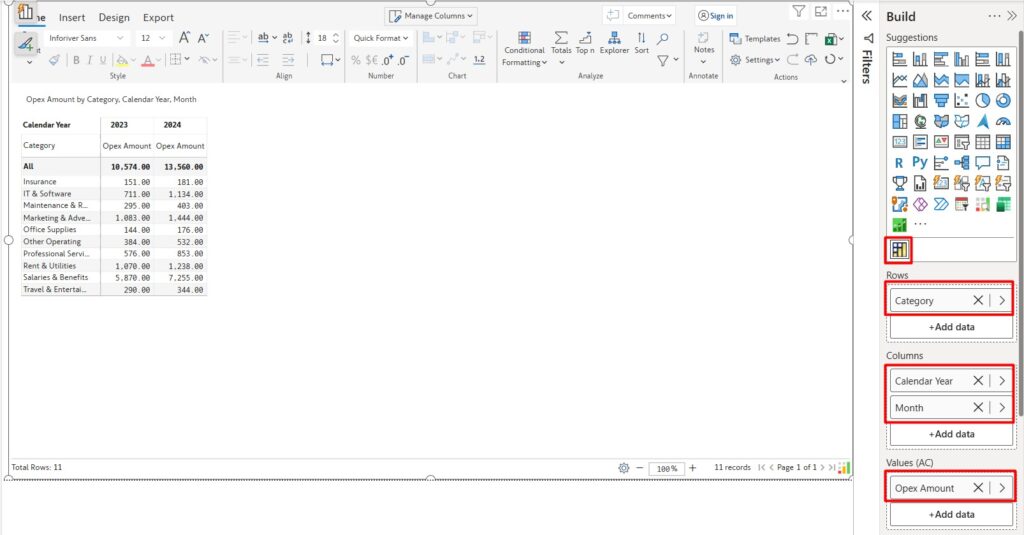
Step 2: Configure the Visual
- Drag and drop the visual onto the report page.
- Add the same fields used in your default matrix (e.g., Category, Year, Opex Amount).
- You should now see your data displayed identically to the original matrix.
Step 3: Forecast for 2025
We’ll start forecasting using the average of 2023 and 2024 values.
Note: To use forecast and writeback, you must have a trial license and account.
Free Trial: https://inforiver.com/writeback-matrix/trial/
How to set up after trial is processes: https://docs.inforiver.com/admin-console
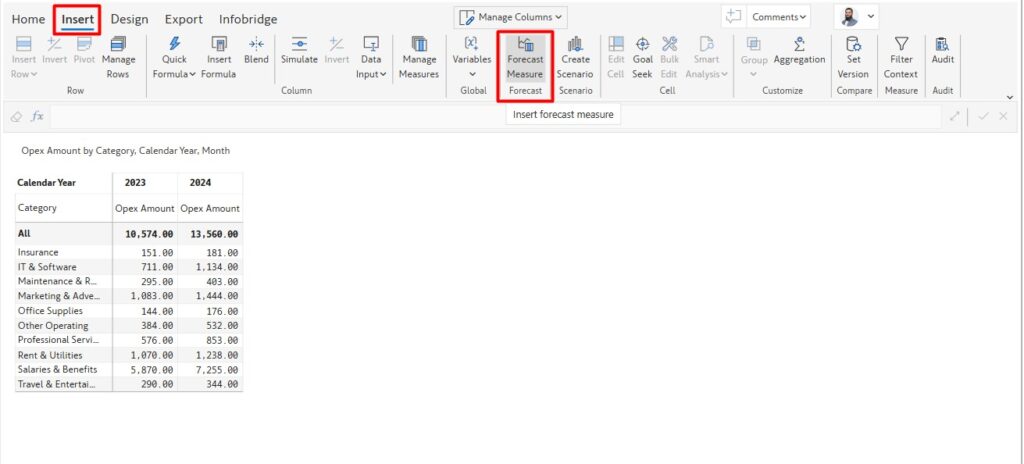
- Go to the Insert tab.
- Click Forecast Measure.
- In the popup, configure the forecast:
- Measure Name: Forecast Amount
- Forecast Period: Jan 2025 – Dec 2025
- Closed Period: Measure
- Linked Measure: Opex Amount
- Open Period: Data Input
- Default Value: None
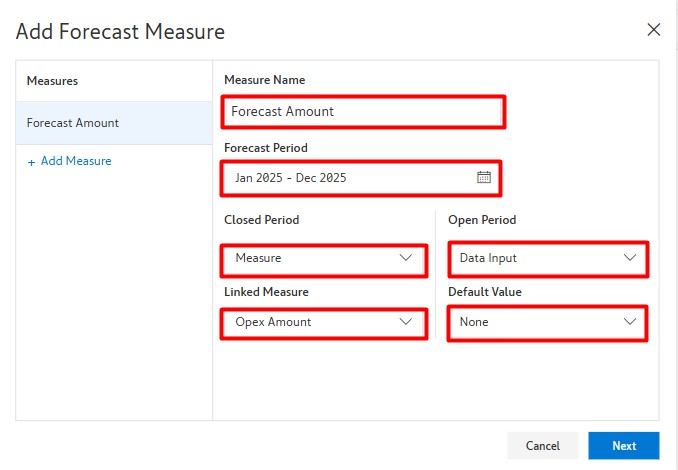
- Click Next, then configure:
- Target Period: Jan 2025 – Dec 2025
- Copy Source: Opex Amount
- Apply Operation: Average of Period Range
- Source Period: Jan 2023 – Dec 2024
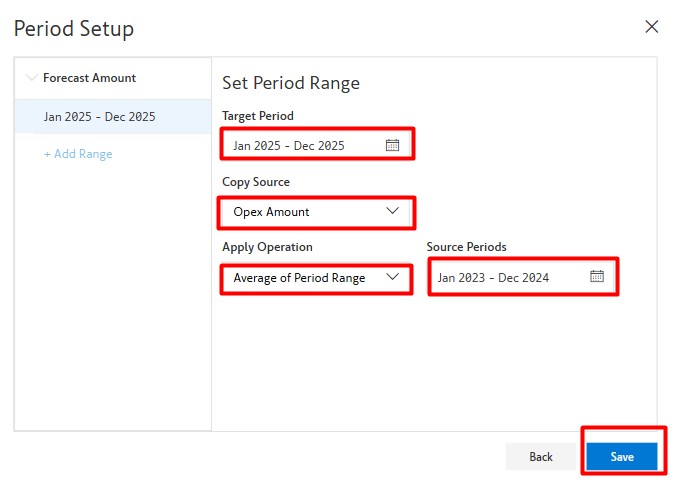
- Click Save.
You’ll now see a new Forecast column for 2025 alongside 2023 and 2024. To hide the historical forecasted periods:
- Go to Home tab → Click dropdown beside Hide → Select Hide Closed Periods.
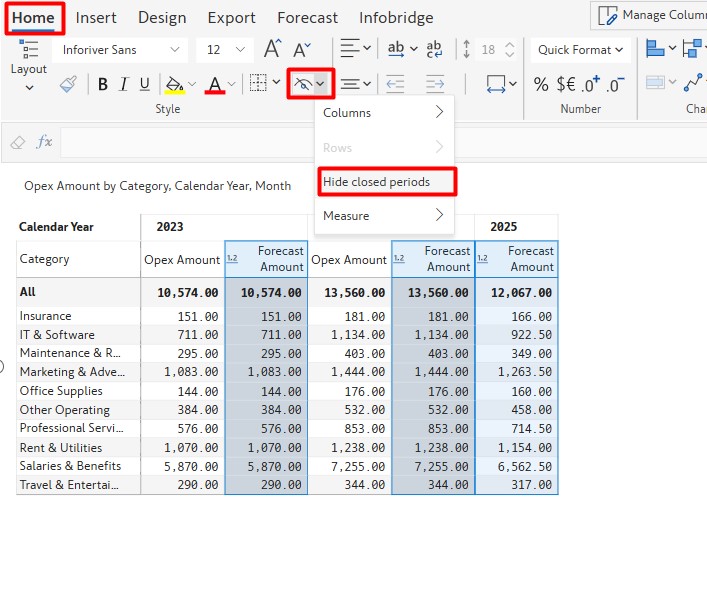
- You will get the following result after hiding the close period.
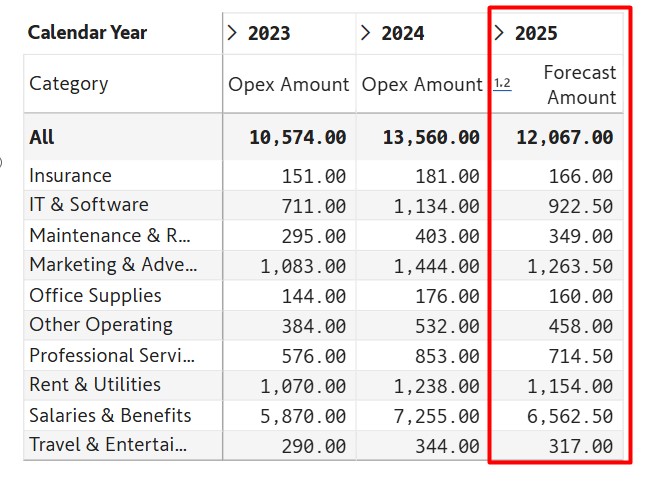
The forecast amount is distributed proportionally according to the previous year’s values.
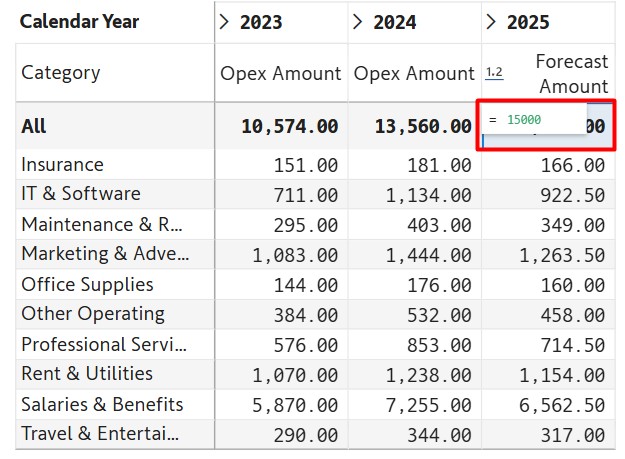
Step 4: Manually Adjust Forecast
Inforiver allows you to directly edit the forecasted values.
- Click on the total amount of forecast column for 2025.
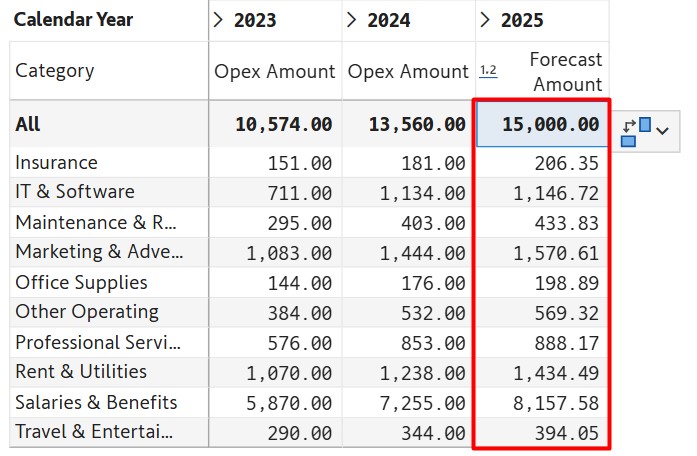
- Enter a new value and press Enter.
The amount will be redistributed proportionally across categories based on previous years’ weights.
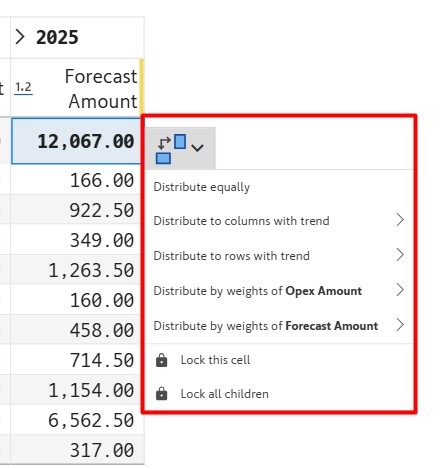
You can also:
- Edit child values manually, and totals will auto-update.
- Change the distribution type by selecting the total forecast amount.
Step 5: Writeback to Microsoft Fabric Lakehouse
Now let’s save this forecast data for your Fabric Lakehouse.
We’re using Lakehouse for simplicity. Warehouse writeback requires more setup, which you can explore later through Lumel’s documentation.
Writeback Setup:
- Go to the Export tab → Click Settings.
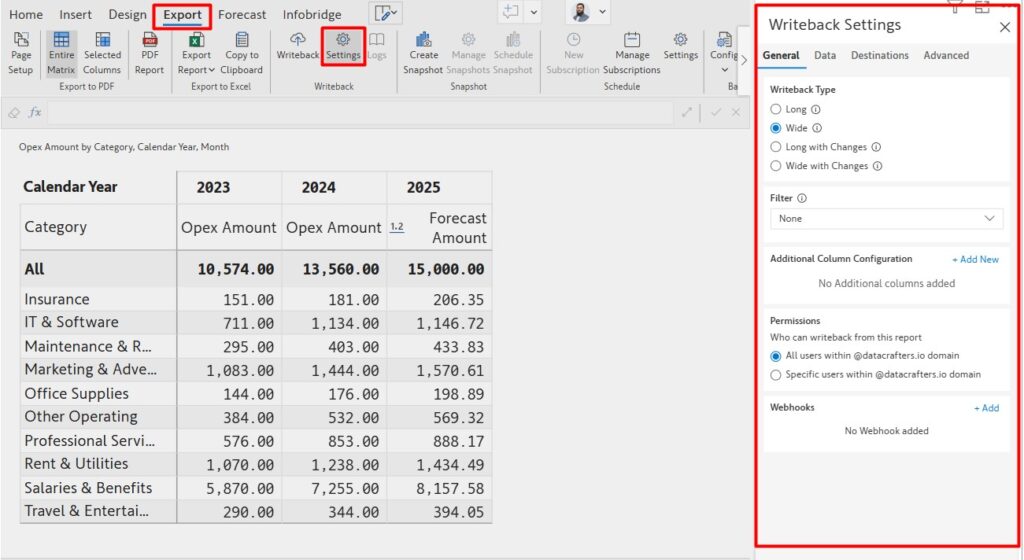
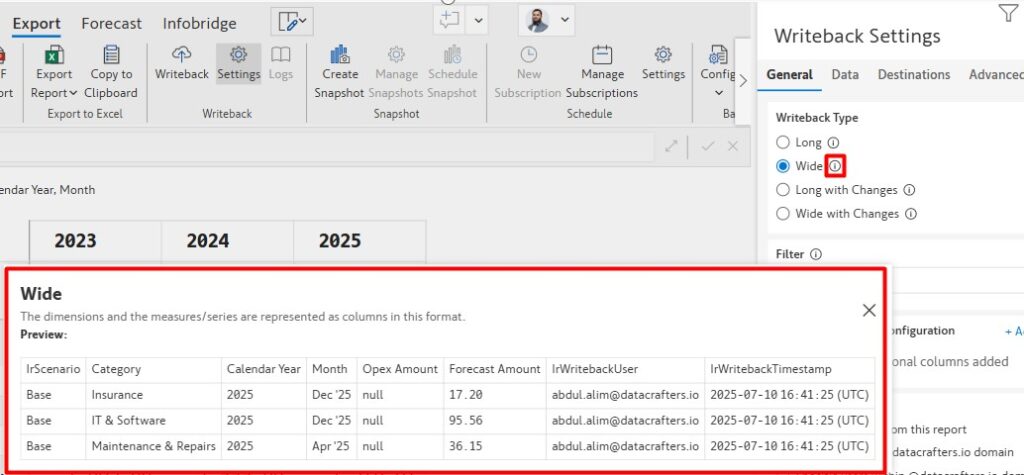
- Under General, choose Wide format (recommended for tabular format).
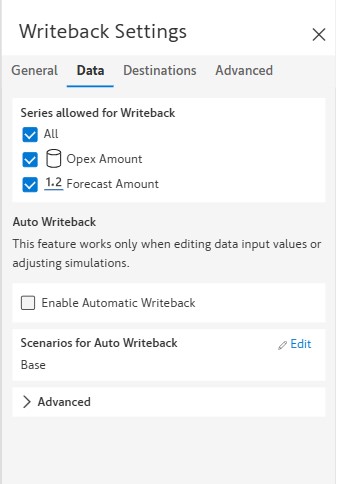
3. Navigate to the Data tab → Select all fields you want to write back.
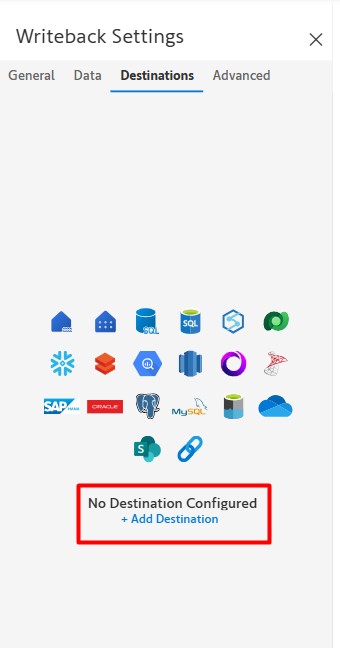
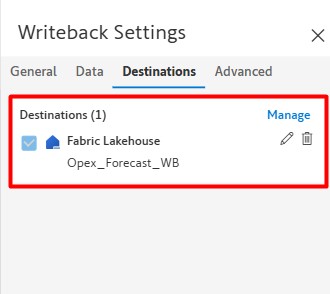
- Go to the Destinations tab → Click Add New Destination.
This opens a browser window.
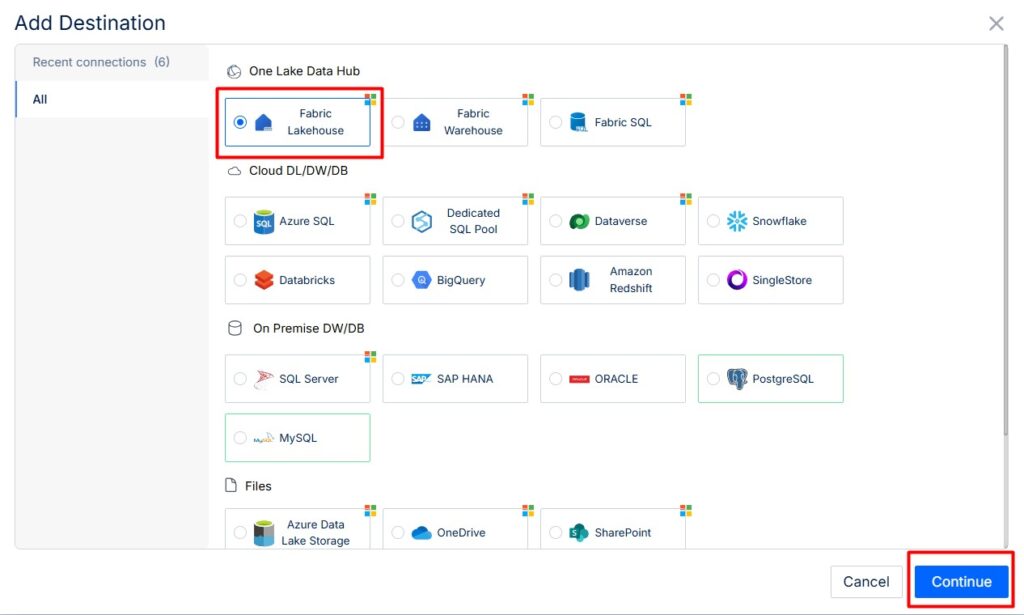
- Choose Fabric Lakehouse and select Continue.
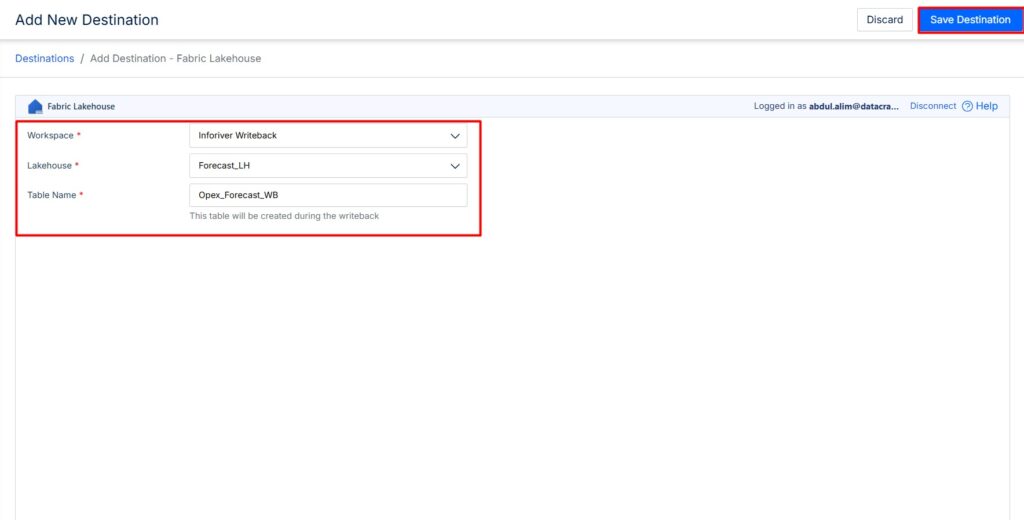
- Choose your Workspace, Lakehouse, give your table a name and select Save Destination.
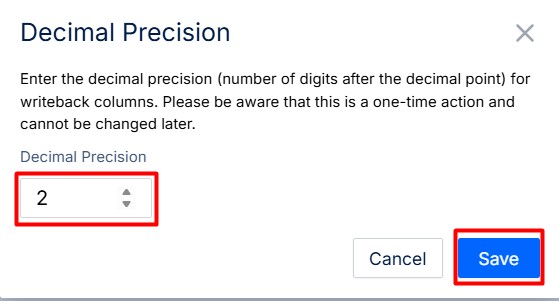
- Set your decimal places, then click Save.
- Your destination will now appear in the visual’s destination list.
Step 6: Perform the Writeback
- Click the Writeback button in the visual

- Once complete, you’ll see a success message.

- Finally, open your Lakehouse in Microsoft Fabric to confirm the data has been successfully written.
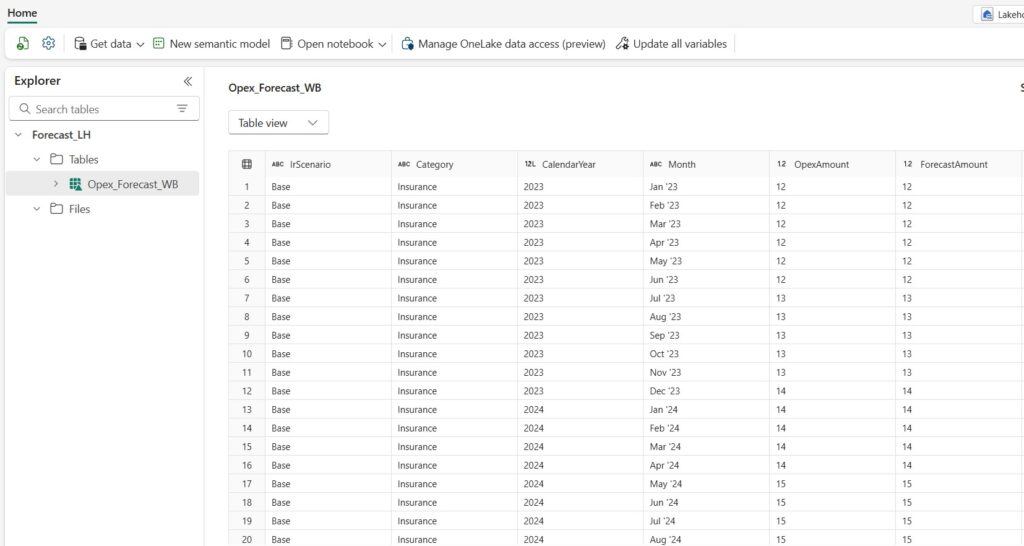
You’ve now successfully completed a comprehensive forecasting and writeback workflow using Inforiver Writeback Matrix in Power BI, tailored for enterprise financial planning.
- Forecasted Future Values Using Historical Data
By leveraging historical operational expense data from 2023 and 2024, you created a data-driven forecast for 2025. Instead of manual estimations or static spreadsheets, you applied dynamic calculations—such as the average of past periods—to generate forward-looking insights with minimal effort. - Edited Forecast Values Directly Within Power BI
One of the most powerful capabilities of Inforiver is the ability to override system-generated forecasts. You updated forecast values manually right inside the report, with the visual automatically redistributing amounts across categories based on historical weights. This gives decision-makers flexibility to apply business judgment while retaining consistency and traceability. - Written the Forecasted Data Back to Microsoft Fabric Lakehouse
Once the forecast was finalized, you didn’t just leave it in a visual—you operationalized it. By writing back the data directly to Microsoft Fabric Lakehouse, your forecast becomes part of the centralized data ecosystem. This allows further downstream processing, reporting, integration with planning tools, or audit tracking, all without leaving Power BI.
Why This Matters for Finance Teams
This end-to-end workflow eliminates the limitations of traditional Excel-based forecasting. CFOs, finance directors, and analysts can now:
- Collaborate in a governed environment
- Make real-time adjustments and simulate different scenarios
- Maintain a single source of truth by integrating forecasts into the enterprise data platform
- Ensure auditability and version control with writeback features
In summary, this approach empowers finance professionals to move faster, act smarter, and plan more accurately—all within the familiar Power BI environment, enhanced by Inforiver’s powerful capabilities.
For further learning and setup, explore Inforiver Documentation.
In Part 2, We demonstrate Sales Forecasting, Be sure to check it out


