

Dataflows are collections of tables that perform data transformations independently within Power BI services. It leverage the Power Query engine and the Common Data Model to execute necessary transformations, making the data available for reuse across different dataflows and the Power BI semantic model (formerly known as a dataset).
Transformation is crucial not only for data cleansing but also for effectively managing large datasets. As Matthew Roche from Microsoft’s Power BI CAT team aptly puts it, “Data should be transformed as far upstream as possible, and as far downstream as necessary.” In simpler terms, if you can transform your data at its source or outside the Power BI semantic model, you should do so. This approach reduces the load on Power BI, maximizing efficiency and effectiveness.
Dataflows, introduced in 2019, have evolved significantly with the release of Dataflows Gen2 in Q1 2024 within the Microsoft Fabric ecosystem. While both versions are powered by Power Query, the key difference lies in the ability to define destinations for Dataflows Gen2, as detailed in the official Microsoft documentation here.
Why Choose Dataflow Gen2?
The advent of Dataflows Gen2 brings about a host of advanced features designed to simplify data transformation, here are some key reasons to choose Dataflow Gen2:
- Simplified Authoring: Enjoy a streamlined process with fewer steps and ongoing feature enhancements for an improved user experience.
- Autosave Feature: Your work is automatically saved as drafts, allowing for uninterrupted development without the need to publish dataflows immediately.
- Enhanced Data Destinations: Store processed data in Lakehouse, Warehouse, SQL Database, Azure SQL Database, or Azure Data Explorer (Kusto).
- Pipeline Integration: Execute dataflow-related actions directly from Pipelines, enhancing workflow efficiency.
- Improved Performance: Benefit from an enhanced computing engine that optimizes transformations and data retrieval with Lakehouse and Warehouse items in your workspace.
Although the data factory currently includes only two primary properties—Dataflow Gen2 and Pipeline—this guide focuses exclusively on creating Dataflows Gen2. We will walk you through the step-by-step process of leveraging the robust capabilities of Dataflows Gen2, shedding light on its potential within the Microsoft Fabric ecosystem.
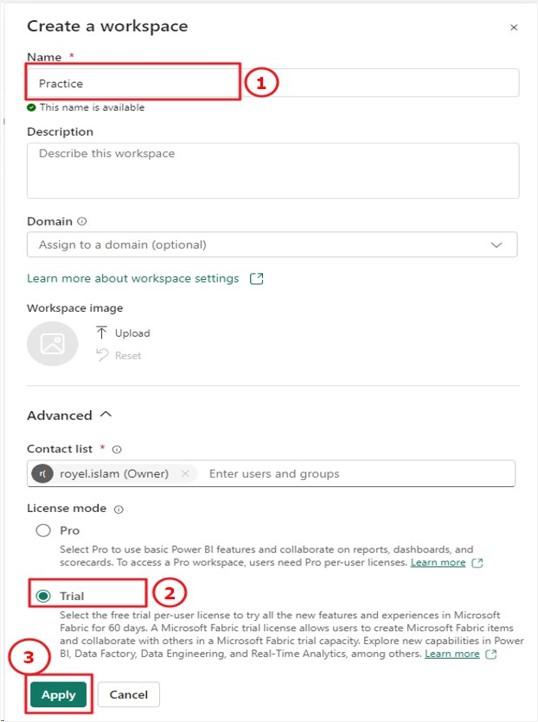
Step 1: Create a Workspace
To create Gen2 dataflows, you need a Fabric capacity workspace. Start by accessing the Power BI service and creating a workspace with a Fabric trial. In this example, we named our workspace Practice (1), selected the license type trial (2), and clicked Apply (3).
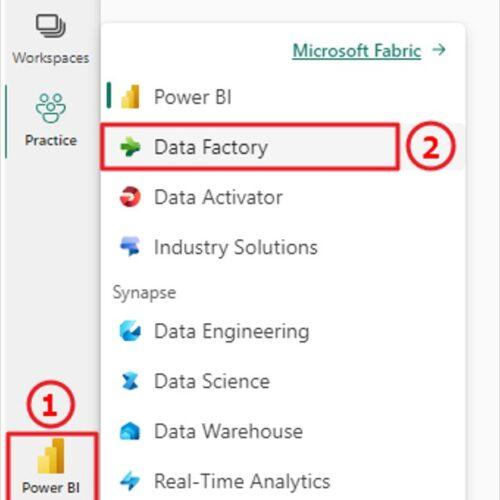
Step 2: Create Dataflow Gen2
Dataflow Gen2 belongs to the Data Factory tab. You can navigate to the Data Factory in two ways:
Method 1: Click the Power BI (1) icon in the bottom right corner, then select Data Factory (2).
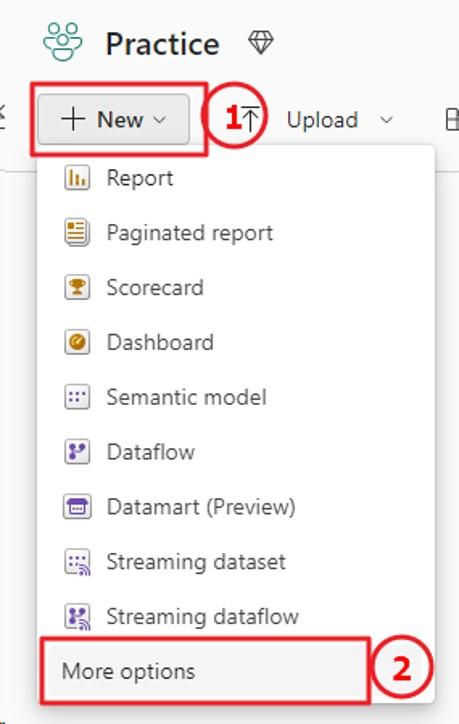
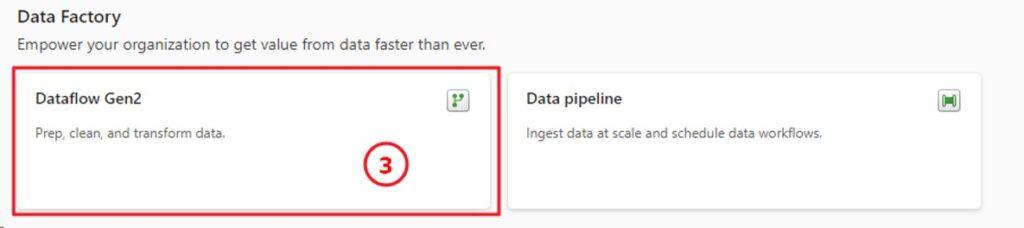
Method 2: In the top right corner, click New (1), then select More Options (2). From there, under Data Factory, click Dataflow Gen2 (3).
Step 3: Get Data
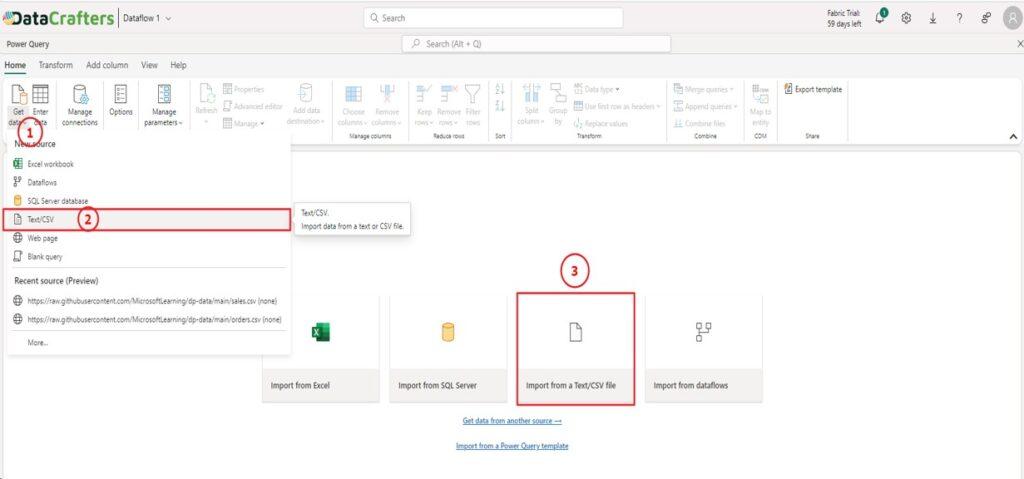
Now, let’s import data into your dataflow. This is where the extract, transform, and load (ETL) process begins. In this example, we’ll extract data from a CSV dataset. From the home navigation, click Get Data (1), then select Text/CSV (2) or click Import from a Text/CSV file (3) on the initial preview page.
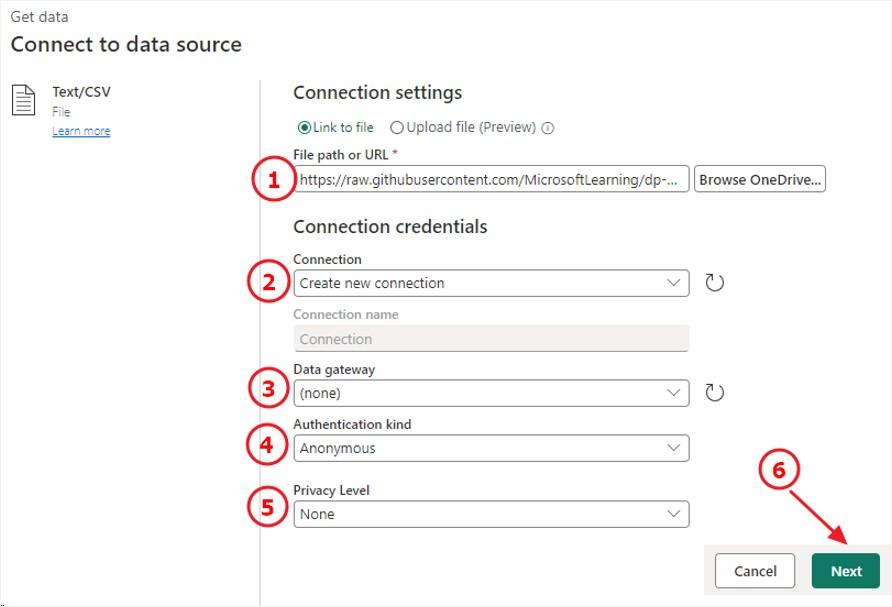
A connection window will open. Enter the following details:
Here,
1. Path: https://raw.githubusercontent.com/MicrosoftLearning/dp-data/main/sales.csv
2. Connection: Create a new connection
3. Data gateway: None
4. Authentication kind: Anonymous
5. Privacy Level: None
6. Action: Click Next
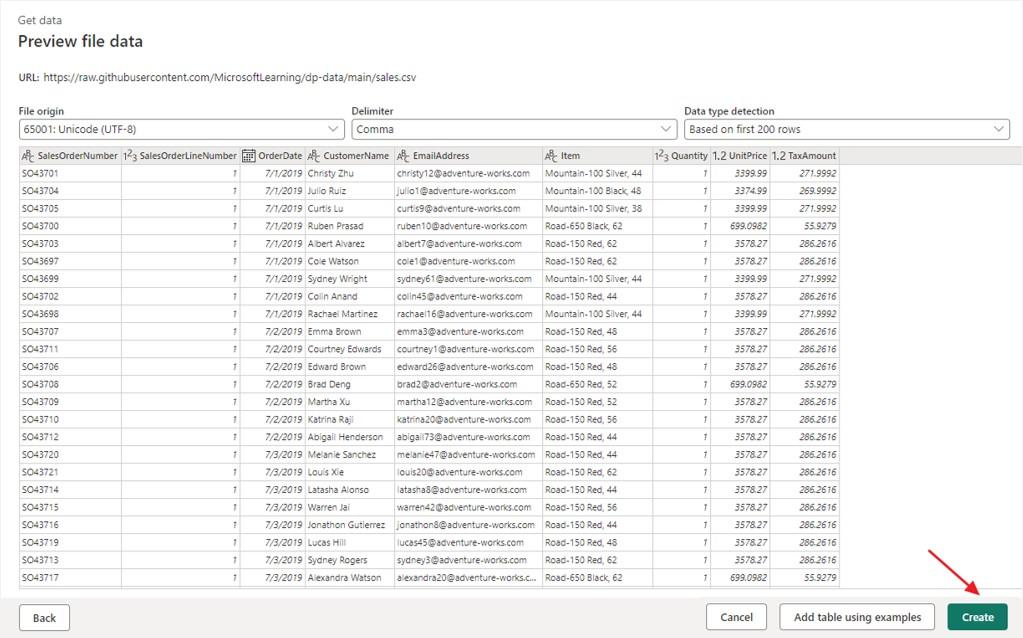
Once the data preview window opens, click Create.
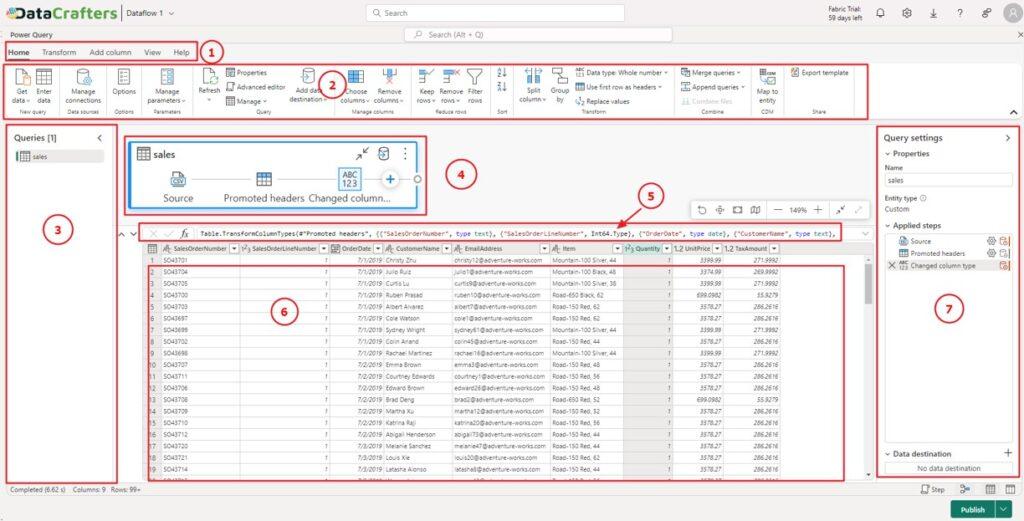
Step 4: Data Transformation
If you’re familiar with Power Query, this interface will feel intuitive. It’s essentially a cloud-based version of the Power Query engine. Let’s explore the Power Query Editor.
Create Custom Columns
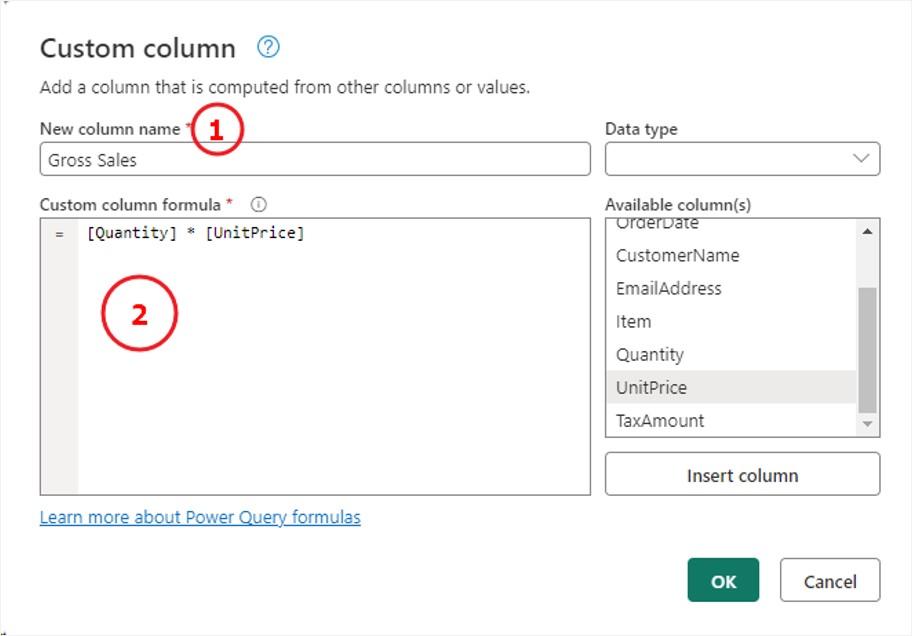
Gross Sales: Our dataset includes Quantity and UnitPrice. Multiplying these columns gives us the Gross Sales value. To achieve this, click Add Column > Custom Column and perform the following calculation:
1. Column Name: Gross Sales
2. Formula: [Quantity] * [UnitPrice]
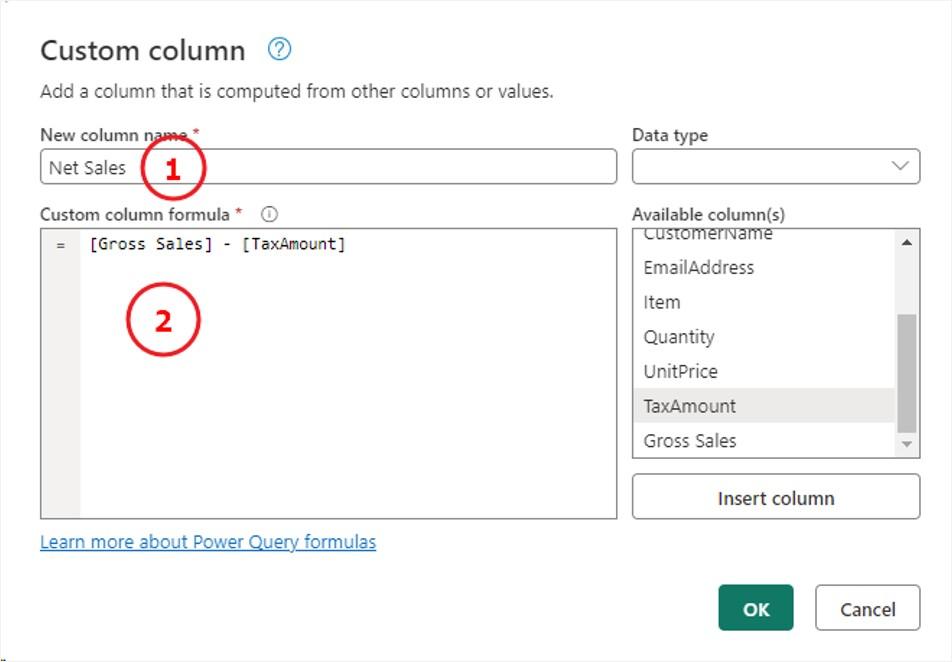
Net Sales: Now that we’ve calculated Gross Sales, subtracting TaxAmount from it gives us the Net Sales value. Again, navigate to Add Column > Custom Column and execute the following calculation:
1. Column Name: Net Sales
2.Formula:[GrossSales]–[TaxAmount]
Adjusting Data Types
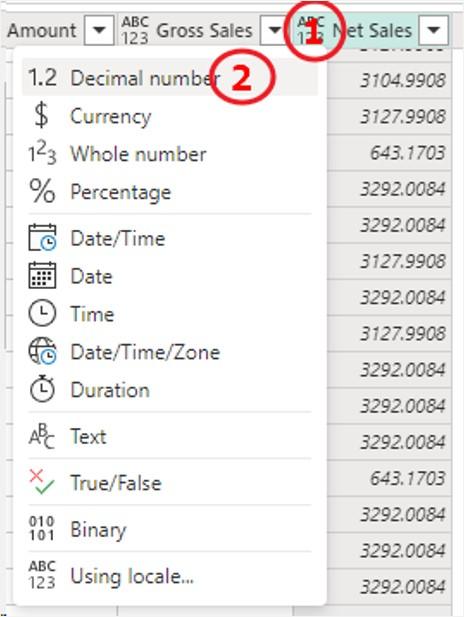
After creating the new columns for Gross Sales and Net Sales, it is essential to ensure they have the correct data types
Since these columns represent currency or decimal data, it is advisable to set the data type to “Decimal number” for both. To do this, simply click on the data type icon next to the column name and select “Decimal number” from the dropdown menu.
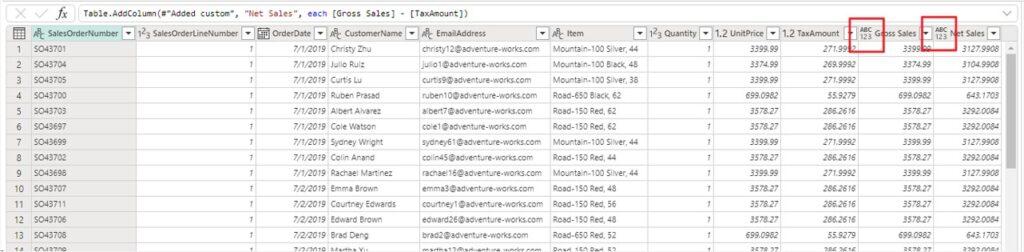
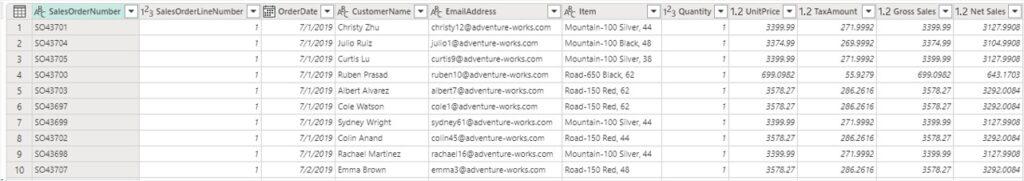
If the previous steps are executed correctly, the final processed data should look like this:
Step 5: Create a Lakehouse
We will save the processed data in a Lakehouse. If you don’t already have a Lakehouse, you can create one by following these steps:
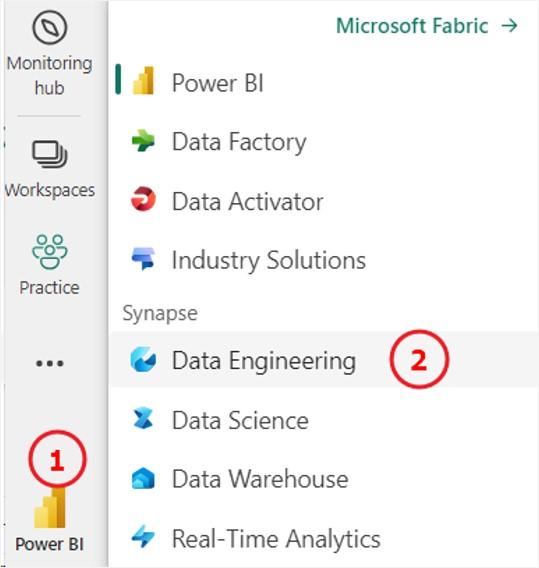
- Click on Power BI (1), then select Data Engineering (2), and navigate to the workspace where you want to create the Lakehouse.
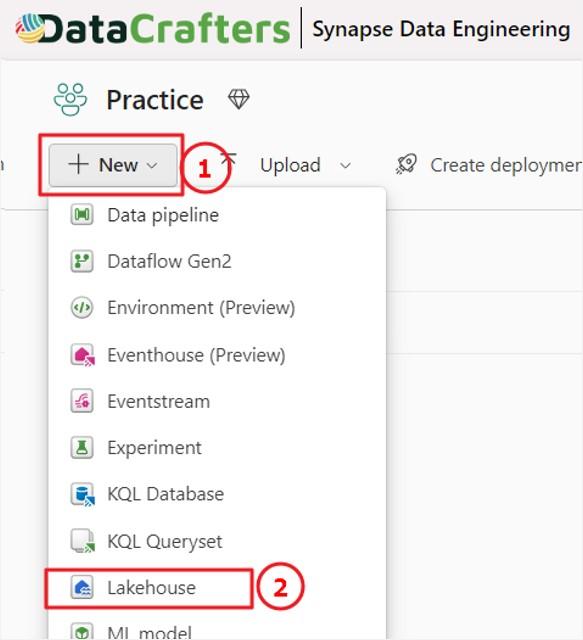
- Under the Practice workspace, click New (1), then select Lakehouse (2).
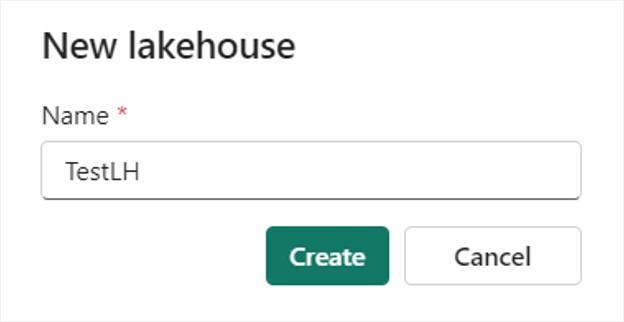
- Give your Lakehouse a meaningful name and click Create.
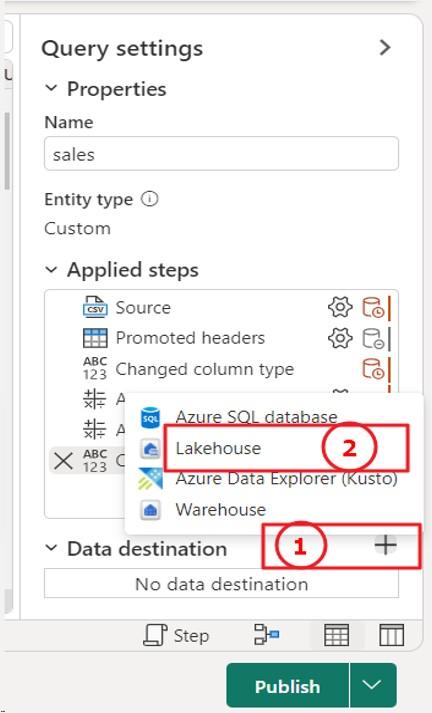
Step 6: Add a Destination
Now, go back to your dataflow and locate the Data Destination option in the query settings. Click the + icon and select Lakehouse to save the processed data into the Lakehouse.
A dialog screen will appear. You don’t need to make any changes here—just click Next.
Next, define the destination path:
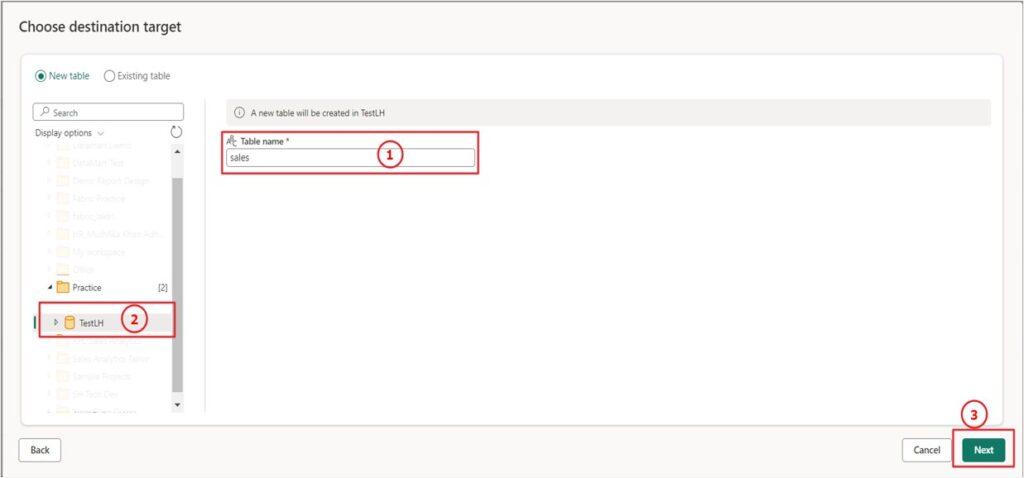
Here’s what you need to do:
1. Set the name of the table that will be created in the Lakehouse.
2. Under the display options, select the workspace (Practice) and the destination Lakehouse (TestLH).
3. Finally, click Next.
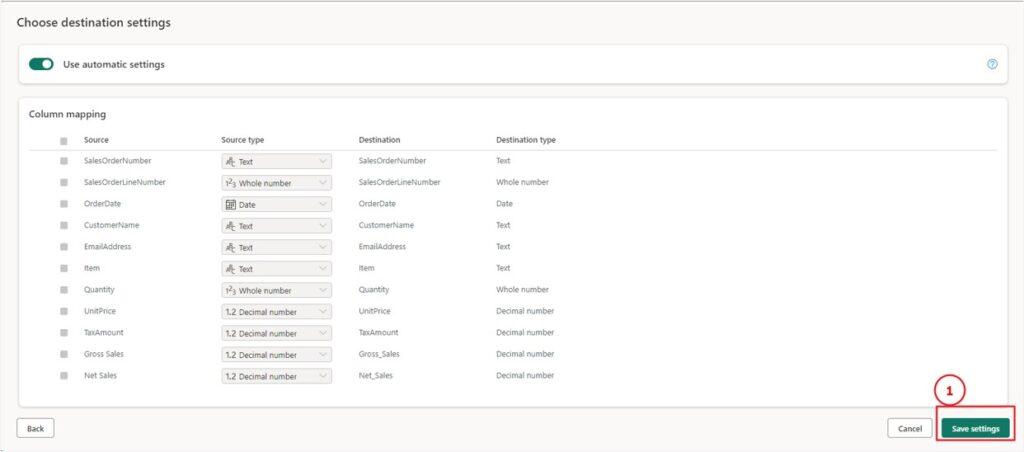
A destination settings window will open. By default, Fabric will automatically detect the source table, its column types, and create the corresponding destination table with the appropriate column types.
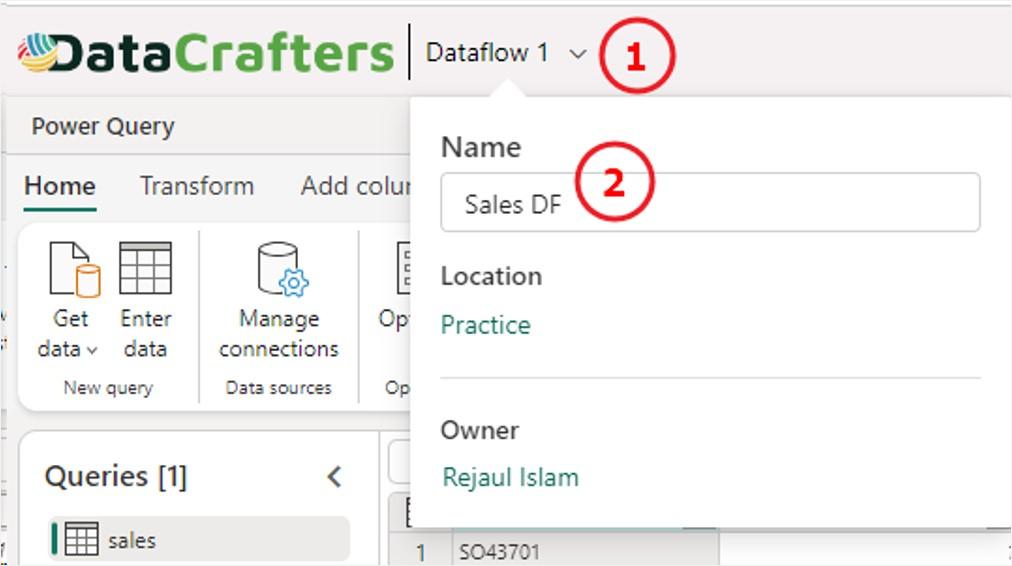
Step 7: Rename Dataflow
Before publishing the dataflow, it’s important to give it a meaningful name. To do this, click on Dataflow1 (1) at the top, and enter Sales DF (2) as the new name.
Step 8: Publish Dataflow
Now that all the required transformations are complete, you need to publish the dataflow to make the changes effective. Click Publish in the bottom right corner of the window. The dataflow will validate all changes and refresh automatically once the publishing process is complete.

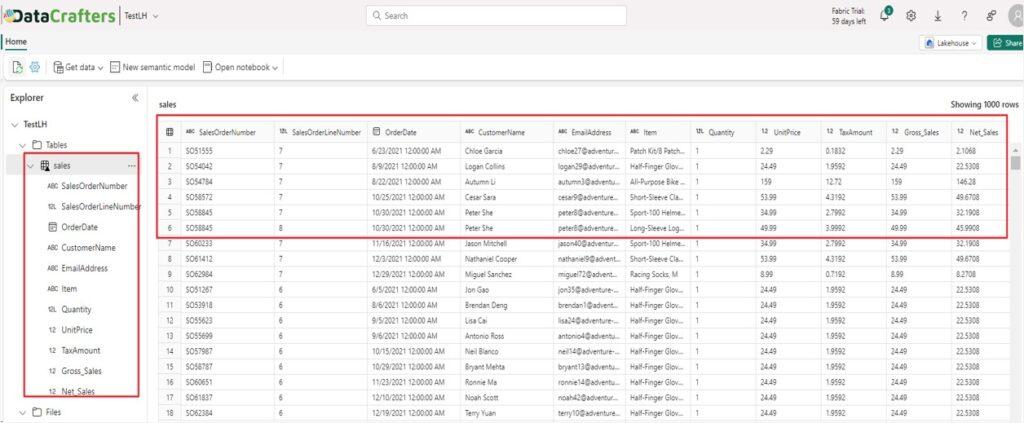
Once the dataflow refresh is complete, you will find a new table (sales) under testLH.
Conclusion
In summary, Dataflow Gen2 simplifies the process of tweaking your data model. It seamlessly integrates into your data pipelines and works efficiently with Lakehouses and Warehouses. One of its key advantages is the ability to separate processing time from your semantic model, which allows Power BI reports and dashboards to deliver business insights faster.
Stay tuned for more articles in this series, where we’ll explore additional experiences within Microsoft Fabric.


