Generating numbers is easy. Building a system that produces numbers trustworthy enough for enterprise decisions is a different challenge entirely. This article walks through how we built a Fabric Data Agent for production use, with the governance, validation, and semantic discipline that makes the difference.
Ask a question, get an answer. That’s the promise behind every AI analytics demo: type “show me year-over-year sales growth for our top customers” and watch a chart appear. The demo always works. Production is where it gets complicated.
Connecting a large language model to a dataset is the easy part, close to a weekend project. Making that connection reliable enough that a finance leader will base a decision on its output is a different problem entirely. A model that writes plausible DAX is not the same as one that writes correct DAX, and in enterprise reporting the distance between plausible and correct is exactly where trust is won or lost.
This article walks through how we closed that gap: the architecture, the workflow, and especially the validation strategy behind a Fabric Data Agent built for real business users, not just for a stage.
Why Reliable DAX Generation Requires More Than an LLM Connection
Modern models are genuinely good at translating natural language into DAX. The challenge is that enterprise reporting introduces failure modes a generic chatbot never encounters. The agent might aggregate a raw transactional column instead of the approved, business-blessed measure. It might read “revenue” as gross when the business has always meant net. It might pick a valid-looking relationship path that returns the wrong numbers, or confidently reference a measure that does not exist at all.
Every one of those mistakes produces a number that looks authoritative and is quietly wrong. A visibly broken answer gets ignored. A plausible wrong answer gets pasted into a board deck.
The goal was to generate DAX an organization could trust, verified by design. That meant building reliability, semantic understanding, business-rule enforcement, and validation directly into the system from the start.
Fabric Data Agent Architecture: End-to-End Flow
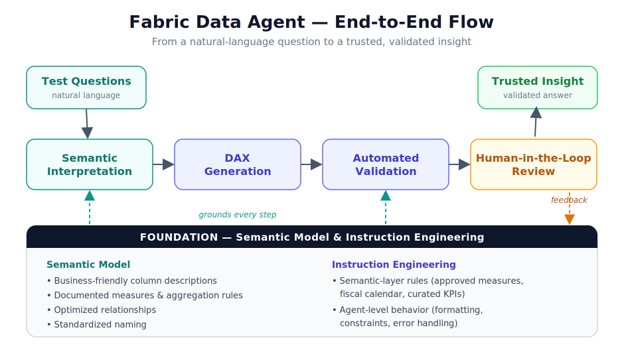
The solution is built on Microsoft Fabric, with Power BI semantic models as the data foundation. Two layers of AI instruction engineering handle governance. An automated notebook-based validation pipeline compares generated DAX against trusted benchmarks. A human-in-the-loop review process catches the cases automation cannot fully judge.
The flow itself is straightforward to describe: a user asks a question in natural language, the agent interprets it against a well-described semantic model, it generates DAX under a set of governing instructions, the validation pipeline executes that DAX and checks the result against an expected benchmark, and anything that fails or looks ambiguous is routed to a human reviewer whose feedback flows back into the instructions and semantic descriptions. Each stage exists to catch a failure the previous stage might have let through.
The Foundation: Get the Semantic Model Right First
If there is one lesson worth carrying out of this project, it is this: AI quality is capped by semantic model quality. Before we enabled a single AI interaction, we spent real effort making the semantic layer something a model could actually reason about.
The most immediate win came from column descriptions. A column called CustID tells a model almost nothing. Rewriting that description as “Customer Identifier used for unique customer tracking” gives the agent the business meaning, the context, and the intended usage in one line. It stops guessing.
Measure definitions got the same treatment. Each measure was documented with its business logic, its aggregation rules, and the calculation intent behind it. Once the agent knew why a measure existed and how it was meant to be aggregated, its DAX generation became noticeably more consistent and far less likely to reinvent a calculation that already existed.
We also spent time on relationship optimization: reducing ambiguity, tightening filter propagation, and making sure context flowed the way the business expected. Naming standardization across fact tables, dimensions, measures, and hierarchies followed. Underneath all of it is a properly modeled star schema with clean fact and dimension tables and relationships that resolve unambiguously. None of this is glamorous. Every cleanup compounded: the clearer the model, the more accurately the agent interpreted it.
Instruction Engineering for Fabric Data Agents: Semantic Layer and Agent-Level Guardrails
With a clean semantic layer in place, the next problem was behavior. Left unconstrained, an LLM will happily aggregate raw columns or invent its own KPI logic. We addressed this with two distinct layers of instructions.
The first layer sits close to the semantic model and encodes the governance rules a careful analyst would already know. In Microsoft Fabric, this maps to the Prep for AI configuration in Power BI: AI instructions, AI data schemas, and verified answers that govern how the agent interprets the model. In our case, the rules included: always use approved measures, never aggregate directly on raw transactional columns, apply fiscal calendar logic rather than the standard calendar, and prefer curated KPIs over ad-hoc calculations. In practice, this layer acts as a governance boundary around DAX generation, defining what the agent is and is not allowed to do.
The second layer is agent-level and controls how the assistant behaves more broadly: response formatting, analytical constraints, how it handles filters, and what it does when it cannot answer. This layer is what made outputs feel consistent across wildly different questions instead of varying with the model’s mood.
From Natural Language to DAX: How the Agent Interprets a Business Question
When a user asks something, the agent works through a short pipeline: understanding the question, interpreting it semantically, pulling the relevant metadata, and only then generating DAX.
Take the example from the top of this post: “Show year-over-year sales growth for top customers.” The agent has to recognize that this needs an approved sales measure, that “year-over-year” is a time-intelligence pattern, and that “top customers” implies ranking. Grounded in the semantic model and bound by the instruction layers, it produces DAX that leans on existing measures rather than raw columns:
Sales YoY Growth % =
VAR CurrentSales = [Total Sales]
VAR PriorYearSales =
    CALCULATE ( [Total Sales], SAMEPERIODLASTYEAR ( 'Date'[Date] ) )
RETURN
    DIVIDE ( CurrentSales - PriorYearSales, PriorYearSales )
Notice it references the approved [Total Sales] measure. That is exactly the behavior the semantic-layer instructions were written to enforce.
Trust, but Verify: Automated DAX Validation
Here’s the part that separates a demo from a production system. Rather than trusting generated DAX because it looks right, we treated every query as something to be proven.
A validation notebook executes the AI-generated DAX, runs an expected benchmark query for the same business question, compares the two numerical outputs, and scores the result. Pass or fail, with the evidence attached. We then scaled that into an automated suite: feed in a batch of test prompts, execute each generated query, compare outputs against benchmarks, log every mismatch, and roll the results up into evaluation metrics. The testing pipeline was built using the Fabric Data Agent SDK, which provided the programmatic hooks needed to drive the agent, capture outputs, and integrate the comparison logic into the notebook workflow.
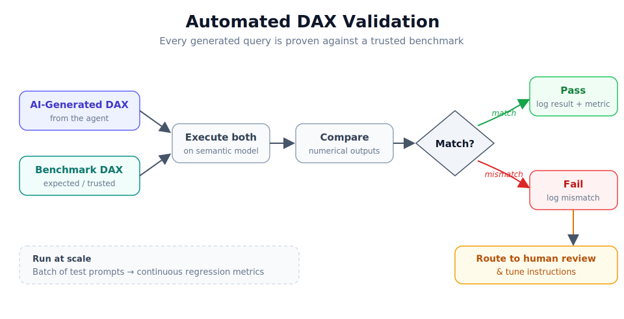
The effect is that the agent now has the analytics equivalent of a regression test suite. Change an instruction or update the semantic model, re-run the notebook, and immediately see whether accuracy held or slipped. Validation cycles that used to be manual and slow became fast and repeatable, and reliability stopped being a vibe and started being a number we could track over time.
Human-in-the-Loop Review: Why Automation Alone Is Not Enough
Automation catches numerical mismatches, but it cannot tell you whether a question was ambiguous in the first place. That’s where human reviewers came in. They focused on the cases automation struggles with: subtle calculation errors, genuine edge cases, business questions with more than one reasonable interpretation, and moments where the agent misread context.
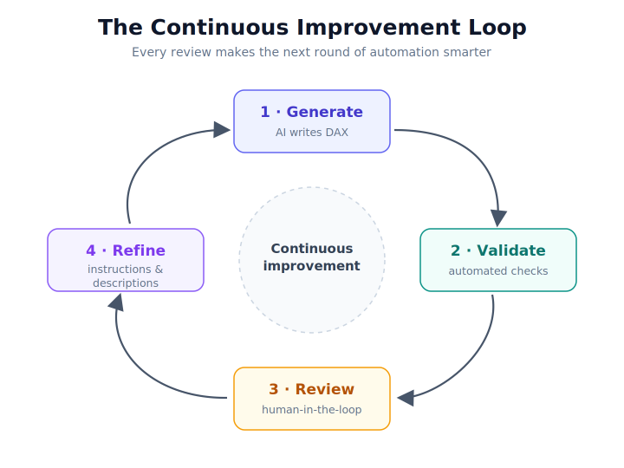
Crucially, reviewer feedback didn’t fix one-off answers. It flowed back into the system: sharper instructions, better column descriptions, new validation rules. Over time this turned into a genuine improvement loop, where each round of review made the next round of automation smarter.
Measuring DAX Accuracy: From Pass/Fail Rates to Systematic Improvement
The final stage tied everything together by comparing three things side by side: the AI-generated result, the expected benchmark output, and the human validation findings. Beyond a simple pass/fail rate, this benchmarking gave us visibility into patterns. Which kinds of questions failed, where the model was systematically weak, and which instructions were worth tuning next. Failure stopped being a surprise and became a roadmap.
Results: What the Fabric Data Agent Delivered for the Business
The payoff showed up across the board. Business users could ask questions in plain language and receive validated DAX results. Semantic grounding plus validation cut down sharply on hallucinated logic. Instruction engineering kept outputs aligned with approved business rules. The automated notebooks made continuous regression testing practical, and the validation pipeline raised overall confidence in the system’s outputs, even when individual answers were verified by the pipeline rather than by hand.
For finance and operations teams, the shift was tangible. Self-service questions that previously required a data engineer now took minutes. Approved business measures became the default path, and validated outputs meant leadership could act on the numbers with confidence.
Three challenges shaped the build. Hallucinated DAX logic, where queries referenced measures or columns that did not exist, was the earliest. It eased substantially once the semantic layer was enriched and the instruction guardrails were in place. Ambiguous business language, where everyday terms mapped to the wrong data entity, was addressed through column descriptions and naming standardization. And validation complexity, the sheer effort of comparing DAX outputs at scale, was solved by leaning hard into notebook-driven automation rather than trying to keep up manually.
What’s Next: Extending the Fabric Data Agent with Multi-Agent Orchestration and Copilot Studio
The foundation is in place. The directions we are most interested in include multi-agent orchestration, where specialized agents handle different domains and coordinate results. Real-time feedback learning, where the system improves from user interactions continuously. AI observability dashboards that surface accuracy trends and failure patterns over time. Fabric’s Code Interpreter for richer in-notebook analysis. And integration with Copilot Studio to extend the agent into broader business workflows.
Final Thought: What Makes a Fabric Data Agent Production-Ready
Building an enterprise AI agent takes far more than wiring an LLM to a semantic model. Reliable AI analytics rests on strong semantic foundations, disciplined instruction engineering, automated validation, real governance, and continuous testing. Layering semantic modeling, DAX validation, automated notebooks, and human review is what turned our Fabric Data Agent from a clever prototype into something an enterprise could actually depend on.
As more organizations adopt AI-powered analytics, producing an answer will no longer be the differentiator. Trust, reliability, and validation are the hard part, and the part that matters.
If you are building a Fabric Data Agent for production use, or evaluating how to bring governance and validation into AI-powered reporting, the pattern holds: foundation first, validation always, humans in the loop. Data Crafters builds this for finance and operations teams. Let’s talk about what it looks like for yours.