Inventory is a vital asset for any product-based business. Whether you’re tracking raw materials or finished goods, effective inventory management impacts cash flow, operations, and financial reporting. But managing inventory isn’t just about logistics – it also requires compliance with accounting standards like International Accounting Standards (IAS) – 2, which ensures inventories are valued correctly at the lower of cost and net realizable value.
In this article, we’ll explore how to build a Power BI dashboard that not only provides real-time inventory insights but also aligns with IAS 2 compliance. We’ll raise common inventory challenges and answer them using visuals, KPIs, and smart analytics.
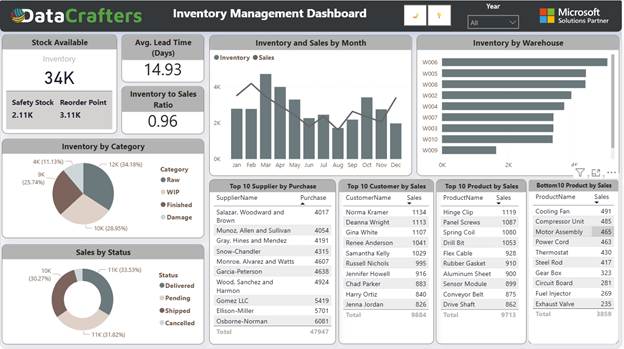
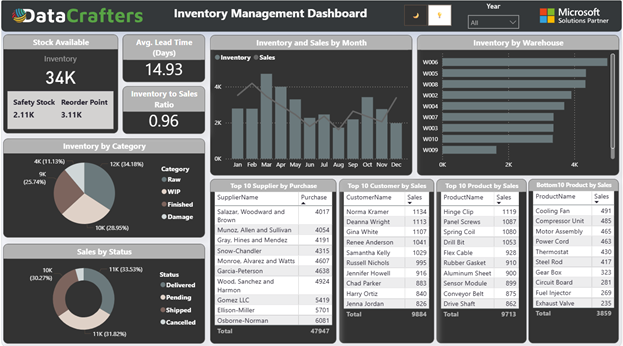
This report offers both light and dark display modes, allowing users to seamlessly switch between them with a single click for improved viewing comfort and personalization.
Our Inventory Management Dashboard has been designed to answer questions such as:
- What is Inventory?
- Key Definitions.
- Why is it important?
- Who is the end user?
- What is the carrying amount of inventory as per IAS 2?
- What is included in the total cost of an item?
- How can we generate real-time alerts when inventory values drop or stockouts occur?
- What is the total inventory value across different warehouses?
- Which items are slow-moving or non-moving?
What is Inventory? Definition and IAS 2 Standards
Inventories are assets:
- held for sale in the ordinary course of business;
- in the process of production for such sale; or
- in the form of materials or supplies to be consumed in the production process or in the rendering of services.
[IAS-2, Para-6]
On the other hand, inventories include goods purchased and held for resale, finished goods produced by the entity, work in progress, and materials or supplies awaiting use in the production process.
Key Inventory Management Definitions and Formulas
- Safety Stock, often referred to as buffer stock, is the additional quantity of inventory kept on hand to protect against uncertainties in demand or supply. It serves as a safeguard to maintain service levels and avoid stockouts caused by delays, supplier or produce issues, or sudden spikes in customer demand.
Formula: Safety Stock= (Maximum Daily Sales x Maximum Lead Time) – (Average Daily Sales x Average Lead Time)
- The average lead time is how long, on average, it takes to go from placing an order to receiving the goods.
Formula: Lead Time = Order Delivery Date – Order Request Date.
- Reorder point is the moment when it’s time to place a new order, so you don’t run out of stock.
Formula: Reorder Point = (Average Daily Demand × Lead Time in Days) + Safety Stock.
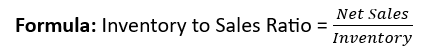
- Inventory to Sales Ratio (ISR) compares the amount of inventory a company holds against its sales over a specific period.
Why an Inventory Management Dashboard Matters for Your Business
An Inventory Management Dashboard is crucial because it transforms raw stock data into real-time, actionable insights – helping businesses make smarter, faster decisions. Here’s why it matters:
- Real-Time Visibility: It gives a clear view of stock levels, movement, and locations – eliminating guesswork and enabling proactive decisions.
- Demand & Supply Alignment: By monitoring trends in sales, lead times, and reorder points, businesses can align procurement with actual demand – reducing stockouts and overstocking.
- Financial Accuracy (IAS 2 Compliance): It supports compliance with accounting standards by highlighting inventory that may require write-downs due to damage, obsolescence, or falling market value.
- Operational Efficiency: Tracking KPIs like inventory turnover, safety stock, and slow-moving items helps streamline warehouse operations and reduce carrying costs.
- Informed Strategic Planning: Executives and planners use it to identify best-selling products, top suppliers, and underperforming stock – improving forecasting and investment decisions.
- Who is the end user?
- Inventory and Supply Chain Managers
- Governance (Decision-Makers) in Manufacturing, Retail or Distribution
- Inventory planners and procurement specialists
What is the carrying amount of inventory as per IAS 2?
Stop and think
Why do businesses hold inventory? How can they identify how much each item cost, and therefore what its value should be at the end of an accounting period? What difference does holding a large amount of inventory, rather than a small amount, make to the business’s operations – and to its financial statements?
However, writing down this formula hides three basic problems.
- How do you manage to get a precise count of what inventory is held at any one time?
- Even once it has been counted, how do you value the inventory?
- Assuming the inventory is given a value, how does the double entry bookkeeping for inventory work?
Counting inventories
In more complicated cases, where a business holds considerable quantities of varied inventory, an alternative approach to establishing quantities is to maintain continuous inventory records. This means that a record is kept for every item of inventory, showing receipts and issues from the stores, and a running total. A few inventory items are counted each day to make sure the records are correct – this is called a ‘continuous’ count because it is spread out over the year rather than completed in one count at a designated time.
Measurement of Inventories:
Inventories shall be measured at the lower of cost and net realizable value (NRV). [IAS – 2, Para-9]
Valuing inventories
- Inventory is valued at the lower of (historical) cost of purchase, and net realisable value (NRV).
- NRV is the expected selling price less any costs to be incurred in achieving that sale.
- Cost comprises: purchase price, carriage, duties and conversion costs to bring item to its present location and condition.
Determining the cost of inventory
Inventories may be:
- Raw materials or components bought from suppliers
- Finished goods which have been made by the business but not yet sold, or
- Part-completed items (this type of inventory is called work in progress or WIP).
What is included in the total cost of an item?
The total cost of an item includes all costs incurred in bringing the item to its present location and condition. This consists of
- The purchase cost of raw materials
- Carriage
- Import taxes and duties
- Conversion costs
The cost of inventories shall be assigned by using the first-in, first-out (FIFO) or weighted average cost (AVCO) formula. An entity shall use the same cost formula for all inventories having a similar nature and use to the entity. For inventories with a different nature or use, different cost formulas may be justified.
How can we generate real-time alerts when inventory values drop or stockouts occur?
Another advantage of Power BI is its integration with Power Automate. You can automate workflows such as:
- Sending alerts when slow-moving inventory increases beyond a set limit;
- Emailing finance when Safety Stock drops below a safety threshold;
- Generating a monthly snapshot for audit reviews.
You can also use Row-Level Security (RLS) in Power BI to ensure that only authorized users (e.g., warehouse manager vs finance controller) see relevant data.
Key Inventory KPIs for Better Decision-Making
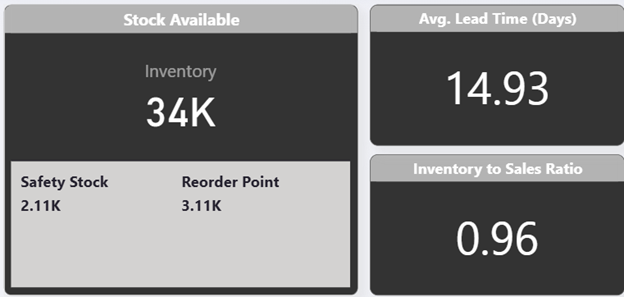
- Inventory (34K): This number tells us the total quantity of stock currently available. Helps avoid overstocking or stockouts.
- Safety Stock (2.11K): Safety stock serves as a buffer to protect against supply chain disruptions or sudden demand spikes. Alerts when inventory is near risk zone.
- Reorder Point (3.11K): Signals when to place new orders. Timely procurement & production planning.
- Avg. Lead Time (14.93 days): Reflects supplier performance. Guides reorder timing.
- Inventory to Sales Ratio (0.96): This ratio indicates how efficiently inventory is being converted into sales. Helps align inventory with sales pace.
Inventory by Category: How to Use Category Insights for Planning
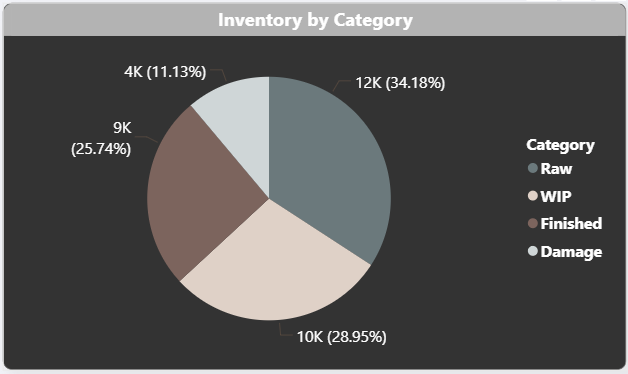
- Raw Materials (12K / 34.18%) – Highest share, indicating strong stock for upcoming production.
- Work in Progress (WIP) (10K / 28.95%) – Shows how much inventory is mid-process, useful for tracking production flow.
- Finished Goods (9K / 25.74%) – Indicates sales readiness; helps assess if supply matches demand.
- Damaged Stock (4K / 11.13%) – A warning sign; too high may lead to write-offs under IAS 2.
Decision Impact:
- Optimize production planning based on WIP and Raw levels.
- Monitor damaged stock to reduce financial loss and support IAS 2 compliance.
- Align Finished Goods with sales forecasts to prevent overstocking.
Sales by Status: Tracking Order Fulfillment and Performance
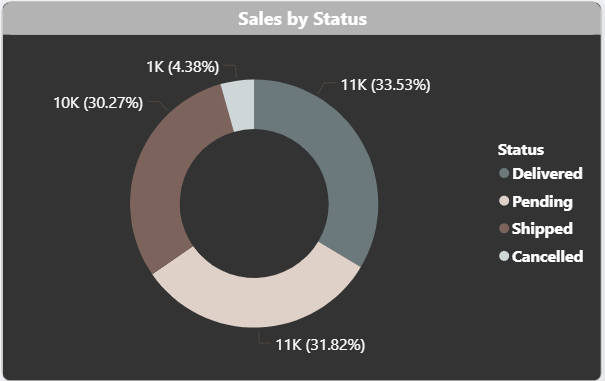
- Delivered (11K / 33.53%) – A healthy portion of orders successfully completed.
- Shipped (10K / 30.27%) – On the way but not yet confirmed delivered; track delivery lag.
- Pending (11K / 31.82%) – High volume still in process; requires fulfillment focus.
- Cancelled (1K / 4.38%) – Small but important to monitor for root causes (e.g., stockouts, delays).
Decision Support:
- Helps identify bottlenecks in the order-to-delivery process.
- Alerts sales and logistics teams to prioritize pending and shipped orders.
- Flags cancelled orders for further analysis, supporting customer satisfaction and operational improvement.
Inventory vs. Sales by Month: Identifying Seasonal Trends and Risks
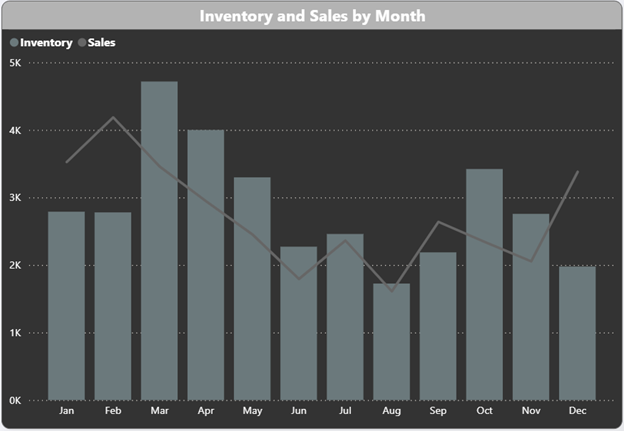
- March–April: Inventory peaks while sales begin to decline — may indicate overstocking or demand drop.
- June–August: Both inventory and sales hit yearly lows — time to analyze seasonal trends or underperformance.
- October–December: Inventory increases again, while sales stay relatively flat — risk of excess stock.
Decision Support:
- Identifies mismatches between supply and demand.
- Helps plan procurement and production based on actual sales trends.
- Supports forecasting and inventory valuation (IAS 2), especially for year-end reporting.
- What is the total inventory value across different warehouses?
Warehouse Inventory Distribution:
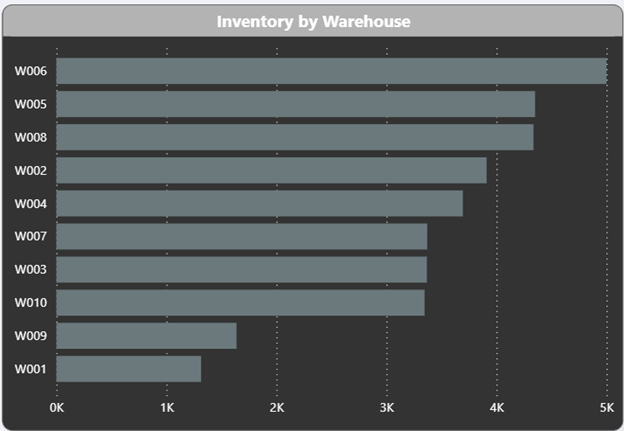
This visual ranks warehouses by inventory volume, helping you quickly identify where stock is concentrated:
- W006, W005, and W008 hold the largest shares, potentially acting as central hubs or overstock locations.
- W001 and W009 show significantly lower inventory, which may indicate minimal activity or potential underutilization.
Key Insights:
- Optimize Space & Cost: High-volume warehouses may need space audits or redistribution to avoid overstocking.
- Improve Fulfillment: Balanced inventory across locations supports faster, localized order fulfillment.
- Support Compliance: Identifying inactive or low-turnover locations helps reduce carrying costs and write-down risks under IAS 2.
- Identifying Slow-Moving and Non-Moving Inventory in Power BI
Top 10 Insights:
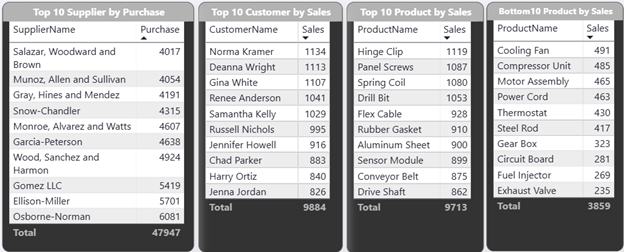
This multi-panel view reveals which suppliers, customers, and products contribute most – and least – to business value:
- These suppliers are critical to your operations. Tracking their reliability, lead time, and pricing trends is essential for minimizing risk and optimizing purchasing.
- Focused account management and personalized service for these clients can increase retention and repeat business.
- These items drive demand and should be prioritized for inventory availability, marketing, and margin analysis.
- Items like Exhaust Valve and Fuel Injector show the lowest movement.
Decision Support:
- Recognize key partners and high-value relationships.
- Align stock with demand drivers.
- Focus efforts where they’ll have the biggest financial impact.
- Review these for potential phase-out, bundling, or discounting. Also assess risk for IAS 2 write-downs if they remain unsold.
Conclusion: Using Power BI for Inventory Optimization and IAS 2 Compliance
Inventory is more than just numbers – it’s strategy, cost control, and compliance. By leveraging Power BI with the logic of IAS 2, you can ensure your inventory valuation is not only visually clear but also financially accurate and audit-ready.
Whether you’re a financial analyst, supply chain manager, or internal auditor, a well-designed Inventory Management Dashboard in Power BI becomes your daily command center – enabling faster decisions, reducing losses, and improving transparency.
In short: a well-designed dashboard is not just a reporting tool – it’s a decision engine for finance, supply chain, and operations.
Website: Inventory Management Dashboard