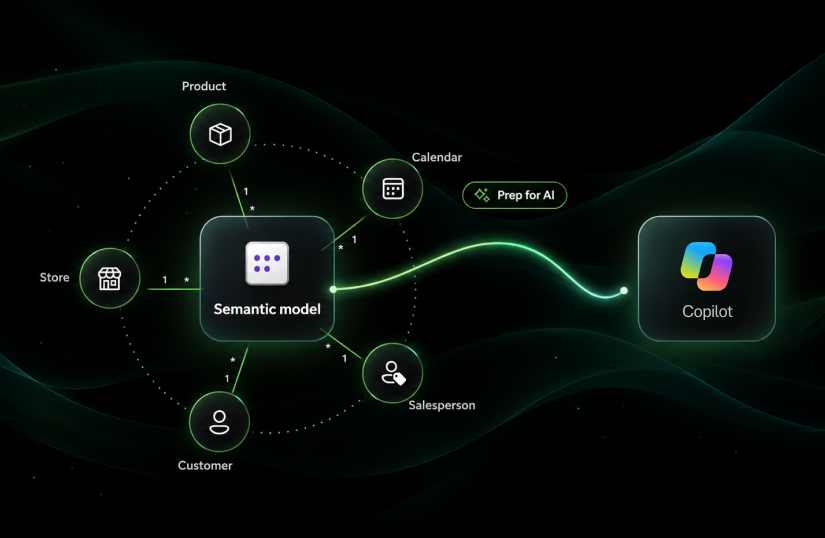

Every satisfying AI answer, every reliable Copilot response, every trusted dashboard traces back to the same thing: the semantic model underneath. When the model is well-structured, documented, and governed, AI tools produce accurate results and reports scale across the organization. When it is not, even the best visuals deliver inconsistent numbers.
This guide covers the design decisions that make a Power BI semantic model scalable, maintainable, and ready for AI: star schema structure, centralized DAX measures, naming and documentation practices, performance optimization, Prep for AI configuration, and integration with Microsoft Fabric. It uses a practical sales and budget model as a running example.
In Power BI, a report is only as good as the semantic model behind it. The semantic model is the business layer between raw data and reporting: it defines how tables relate, how business calculations are written, and how metrics are reused across reports. In a well-designed solution it becomes the single source of truth for reporting logic.
Why Power BI Semantic Model Design Matters for AI and Governance
Modern analytics is moving beyond traditional dashboards. Business users now expect to ask questions in natural language, use AI assistants, explore data through conversational analytics, and receive meaningful answers on their own. AI tools produce reliable results when the semantic model is structured, documented, and aligned with business meaning.
A clean semantic model helps both humans and AI understand the data correctly. It gives context to measures, relationships, dimensions, and business rules. When that structure is in place, AI selects the right metric, follows the right relationship path, and returns answers aligned with business definitions.
This guide is written for Power BI developers and analysts who already work with DAX and dimensional modeling. Rather than re-explaining the basics, it focuses on the design decisions that make a model scalable, governable, and ready for AI. It uses a practical sales and budget model as a running example, with fact tables for sales order lines and budget data, dimension tables for calendar, customer, product, salesperson, and store, and a dedicated measure table for reusable DAX.
The goal is to show how a semantic model can support reporting, performance, maintainability, governance, Microsoft Fabric integration, and AI-driven analytics.
In the example, the semantic model exposes entities, relationships, and reusable calculations so consumers work with fields like Product Name and Total Sales Amount instead of keys like OrderLineID or DateKey. Facts live in Fact Sales Order Lines and, through their dimension relationships, can be sliced by product, customer, store, and date. All reusable logic sits in a dedicated _Measures table, keeping DAX separate from the physical tables.
Why Scalability and Maintainability Are Important
A semantic model has to absorb growth (more data, more reports, more questions) and adapt when business definitions shift. Both properties come from the same foundation: a clean separation between fact tables (Fact Sales Order Lines, Fact Budget) and conformed dimensions (Calendar, Product, Store, Customer, Salesperson), with logic defined once and reused.
Because dimensions are shared and logic is centralized, new questions such as sales by category, store versus budget, year-to-date trend, or revenue by customer segment are answered through existing relationships and measures rather than per-report workarounds. That same consistency is what makes the model dependable for AI: clean names, single definitions, and unambiguous relationships improve Copilot and Q&A accuracy exactly as they improve maintainability.
Star Schema in Power BI: Structuring Facts and Dimensions for Performance
A star schema is one of the most effective design patterns for Power BI semantic models. In a star schema, fact tables store measurable business events, while dimension tables store descriptive business attributes.
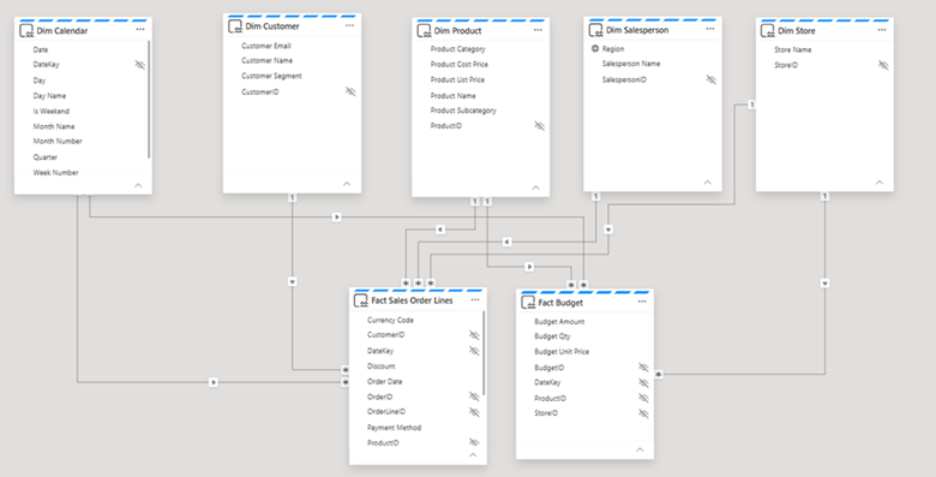
In the example model, Fact Sales Order Lines and Fact Budget are fact tables. They contain numeric values that can be aggregated, such as sales amount, quantity, budget amount, and budget quantity. The dimension tables provide context for analysis:
• Dim Calendar provides date, year, month, quarter, week, and day attributes.
• Dim Product provides product name, product category, subcategory, cost price, and list price.
• Dim Store provides the store name for each retail location.
• Dim Customer provides customer name, email, and segment.
• Dim Salesperson provides salesperson name and region.
The relationship definitions show a clean fact-to-dimension structure. Actual sales connect to every dimension:
‘Fact Sales Order Lines'[CustomerID] –> ‘Dim Customer'[CustomerID]
‘Fact Sales Order Lines'[ProductID] –> ‘Dim Product'[ProductID]
‘Fact Sales Order Lines'[SalespersonID] –> ‘Dim Salesperson'[SalespersonID]
These relationships allow actual sales to be filtered and grouped by customer, product, salesperson, store, and date. The budget table follows the same principle, connecting to the dimensions it shares with sales:
‘Fact Budget'[DateKey] –> ‘Dim Calendar'[DateKey]
‘Fact Budget'[ProductID] –> ‘Dim Product'[ProductID]
‘Fact Budget'[StoreID] –> ‘Dim Store'[StoreID]
This is an important design decision. Actual sales and budget data share common dimensions such as calendar, product, and store. Because of this, the model can compare actual performance against budget using the same business context. For example, the measure below compares actual sales against budget:
Sales vs Budget Amount = [Total Sales Amount] – [Total Budget Amount]
This measure works because both actual sales and budget are connected to shared dimensions. A user can slice the report by product category, store, or month, and the model can calculate the correct variance. This is the power of a well-designed star schema: it keeps the model simple, performant, and easy to analyze. It also gives AI a predictable path to follow, because Copilot and Q&A can join facts to dimensions and apply filters correctly when relationships are clean and unambiguous.
Centralized Business Logic and Reusable Measures
One of the most important best practices in Power BI semantic model design is to centralize business logic. Measures should be created once in the semantic model and reused across reports. In the example model, all measures are stored in the _Measures table. This is a strong design choice because it keeps calculations organized and separate from physical data tables.
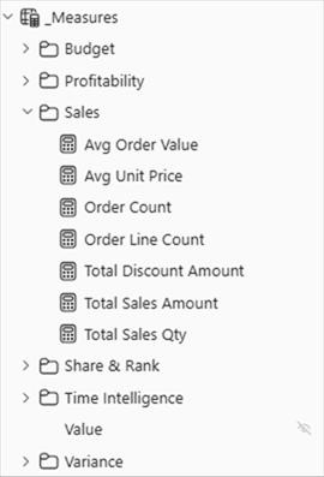
The model includes measures grouped into clear display folders: Sales, Profitability, Budget, Variance, Time Intelligence, and Share & Rank. This makes the model easier for report developers and business users to navigate. For example, the Sales folder contains measures such as:
Total Sales Amount = SUM(‘Fact Sales Order Lines'[Total Amount])
Total Sales Qty = SUM(‘Fact Sales Order Lines'[Quantity])
Order Count = DISTINCTCOUNT(‘Fact Sales Order Lines'[OrderID])
Avg Order Value = DIVIDE([Total Sales Amount], [Order Count])
Budget and variance measures follow the same pattern: Total Budget Amount and Total Budget Qty are simple sums over Fact Budget, while variance measures such as Sales vs Budget Amount % build on the sales and budget totals already defined.
This approach ensures that the definition of each KPI is controlled in one place. For example, if the business definition of gross profit changes, the developer updates the Gross Profit measure in the semantic model. Every report that uses this measure will then follow the same updated logic.
Centralized business logic also improves trust. When different teams build reports using their own separate formulas, the same metric can produce different results. One report may calculate revenue before discount, while another may calculate revenue after discount. One report may use the order date, while another may use the invoice date. These inconsistencies create confusion. A semantic model reduces this risk by providing approved, reusable measures.
This is also valuable for AI. When measures are clearly defined and documented, AI tools are more likely to select the correct metric. Instead of guessing whether to use Total Amount, Unit Price, or Budget Amount, the AI can identify a business-ready measure such as Total Sales Amount or Sales vs Budget Amount.
Power BI Semantic Model Performance Optimization
Performance should be considered from the beginning of semantic model design. A model that performs well with small data may become slow when the number of rows, users, reports, and calculations increases. The example model already follows several good performance practices.
First, it separates facts and dimensions. This avoids one large flat table with repeated customer, product, store, and date attributes. A large flat table may look simple at first, but it can increase model size, reduce clarity, and make maintenance harder.
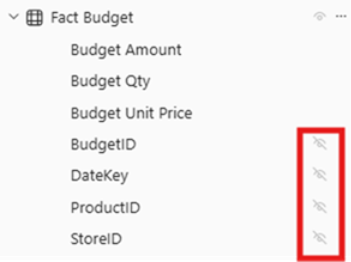
Second, the relationship keys (CustomerID, ProductID, StoreID, SalespersonID, and DateKey) are hidden from report view. This keeps the field list clean and steers both users and AI tools toward the business-ready fields instead of raw keys.
Third, the model uses explicit measures instead of relying on implicit aggregations. For example, users should use Total Sales Amount instead of dragging the raw Total Amount column into a visual and letting Power BI automatically sum it. Explicit measures provide better control, clearer formatting, and reusable business definitions. They also give AI an unambiguous, approved metric to choose, instead of guessing how to aggregate a raw column.
Fourth, the model uses a dedicated Dim Calendar table for time intelligence. This is important because DAX time-intelligence functions work best when the model has a proper date table. Measures such as Sales YTD, Sales MTD, Sales QTD, and Sales LY use the calendar table:
Sales YTD =
CALCULATE(
[Total Sales Amount],
DATESYTD(‘Dim Calendar'[Date])
)
Another important performance point is data reduction. A scalable semantic model should not include every column from the source system. Only columns required for reporting, filtering, relationships, or calculations should be included. Unused columns increase model size and make the field list harder to navigate. In this model, several technical columns are hidden, which is good practice. The same principle should also be applied at the data preparation layer: columns that are not needed at all should ideally be removed before they reach the semantic model.
For large datasets, additional performance techniques may be required, such as:
• Aggregation tables
• Incremental refresh
• Partitioning by date
• Composite models
• Pre-calculated business logic in the data warehouse or lakehouse
• Query testing using Performance Analyzer or DAX Studio
The objective is not only to make the model fast today, but to keep it fast as data volume and report usage grow.
Naming, Metadata, and Documentation: Making the Semantic Model Self-Describing
Clear naming is one of the simplest but most powerful semantic model design practices. A well-named model is easier for report developers, business users, and AI tools to understand. The example model uses business-friendly table names such as Dim Calendar, Dim Customer, Dim Product, Dim Salesperson, Dim Store, Fact Sales Order Lines, and Fact Budget.
These names immediately communicate the purpose of each table. The Dim and Fact prefixes also help users understand whether a table is used for descriptive filtering or numeric analysis. The columns are also named clearly, for example Customer Name, Customer Segment, Product Name, Product Category, Salesperson Name, Store Name, Payment Method, and Currency Code. The measures are written in business language, for example Total Sales Amount, Gross Profit, Gross Profit Margin %, Total Budget Amount, Sales vs Budget Amount, Sales YoY Change %, and % of Total Sales.
This naming approach is much better than using technical or unclear names such as Column1, Amount_2, Table_Final, or Measure 5.
Set the Data Category for geographic fields
Naming is only one part of good metadata. Power BI also lets you assign a Data Category to a column, so the engine understands what the data represents. In this model, the Region column in Dim Salesperson has its Data Category set to Country/Region. This small setting has a large impact: it tells Power BI that the values are geographic, which enables correct map rendering, provides the right field icon and default behavior, and gives Copilot and Q&A clearer context when a user asks a location-based question such as “sales by region.”
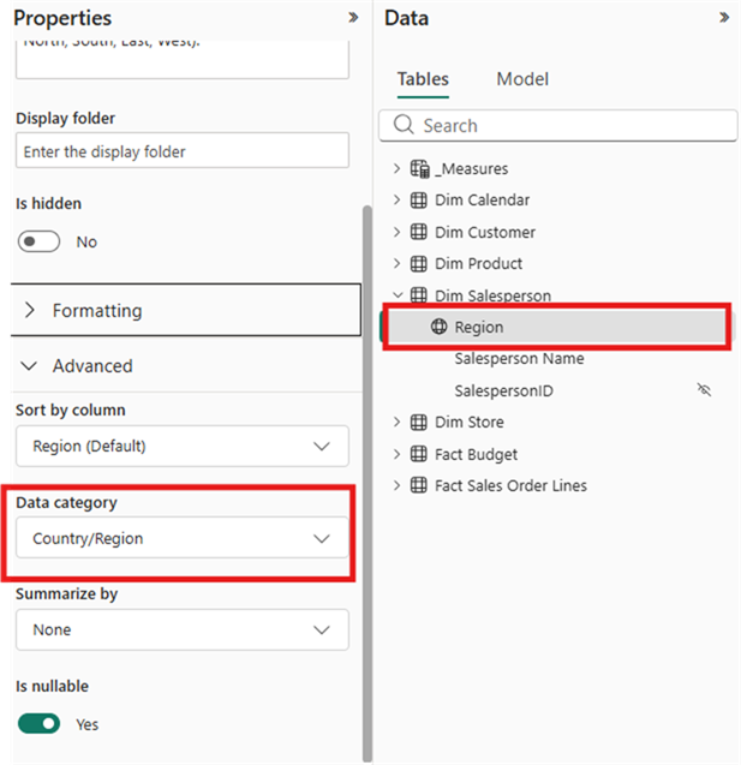
As a best practice, set the appropriate Data Category (Country/Region, State or Province, City, Postal Code, Latitude, Longitude, Web URL, Image URL, and so on) for every column that represents one of those concepts. Geographic categorization improves both map visuals and natural-language analytics.
Document the model with descriptions
Documentation is equally important, and this model is fully documented. Every table, column, and measure carries a description in its definition. A description is metadata that appears as a tooltip in the Fields pane and is also read by AI tools as context. For example, Fact Sales Order Lines is described as a transactional fact table holding one row per sales order line, with quantities, pricing, discounts, and order context, and Total Sales Amount is described as the sum of net sales value after discount across all sales order lines. Even hidden keys are documented, such as DateKey being described as a foreign key to Dim Calendar that is hidden from report view.
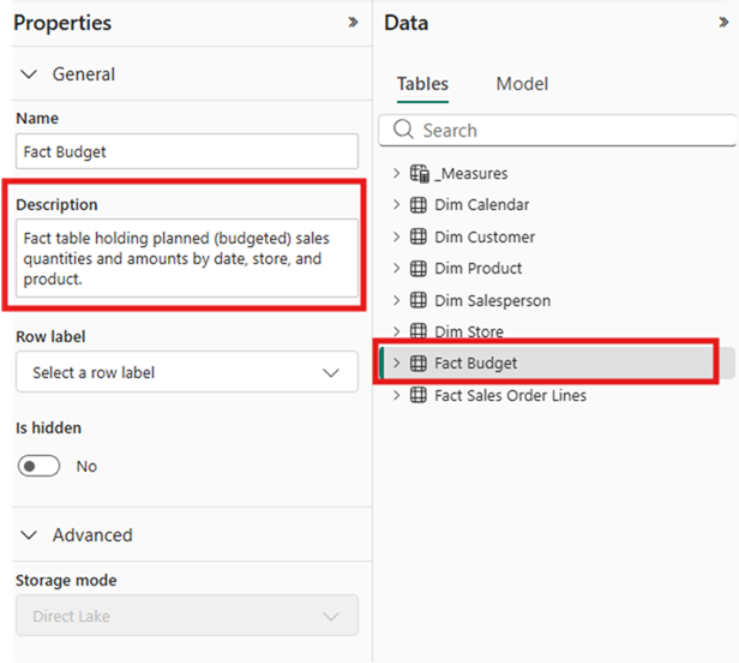
This type of description improves model maintainability. New developers can understand the purpose of each object more quickly. Business users can understand what each field means. AI tools also benefit from metadata because descriptions provide additional context for interpreting the model. Good documentation should explain:
• What each table represents
• What each key measure means
• Which columns are used for relationships
• Which fields should be used for reporting
• Which fields are technical and hidden
• How important business calculations are defined
In AI-driven analytics, documentation is no longer optional. It becomes part of the model’s intelligence layer. These descriptions are also read by Prep for AI and surfaced to Copilot and Fabric Data Agents, making them a direct input to AI accuracy.
Data Quality and Grain Alignment in Multi-Fact Models
A semantic model can organize and define data, but it cannot fully compensate for poor data quality. Data quality must be handled before and during semantic model development. In the example model, relationships depend on key columns such as DateKey, ProductID, StoreID, CustomerID, and SalespersonID.
These keys must be valid and consistent. If a sales row contains a ProductID that does not exist in Dim Product, product-level analysis may become incomplete or misleading. If a budget row has a DateKey that does not exist in Dim Calendar, time-based budget analysis may not work correctly. Data validation should include checks such as:
• Every fact table key should match a valid dimension table key.
• Date fields should be complete and consistent.
• Product, store, customer, and salesperson records should not have unexpected duplicates.
• Amount and quantity fields should use correct data types.
• Discount values should be within expected ranges.
• Budget data should be available at the same grain needed for analysis.
Grain is especially important in this model. Fact Sales Order Lines are at the sales order line level. Fact Budget is at the product-store-date level. This means actual sales are more detailed than budget, but they can still be compared because both tables connect to shared dimensions such as date, product, and store.
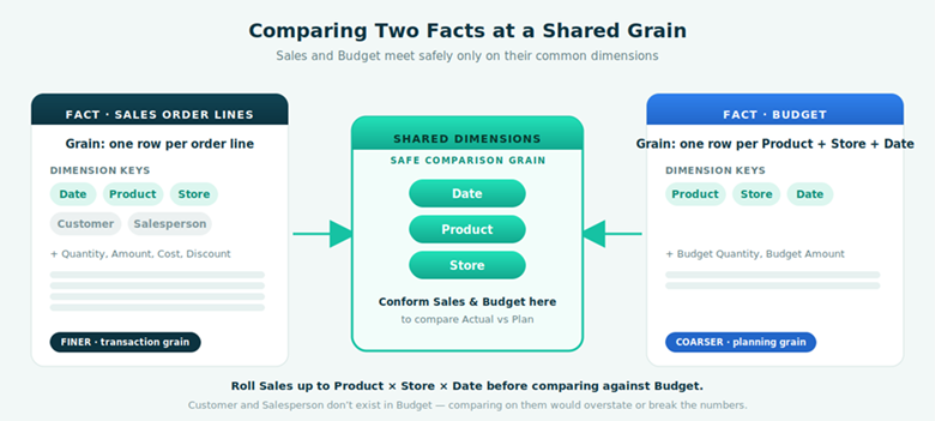
When comparing actuals and budget, the model must ensure that the comparison happens at a compatible level. For example, comparing sales and budget by product, store, and month is valid when both fact tables support those dimensions. However, comparing budget by customer or salesperson would not be valid unless the budget table also contains customer or salesperson keys. A semantic model should guide users toward valid analysis and prevent misleading comparisons.
Data quality also affects AI. If relationships are broken, values are missing, or business rules are inconsistent; AI-generated insights may be inaccurate. A clean semantic model starts with clean and validated data.
Microsoft Fabric and Modern Analytics Integration
Microsoft Fabric encourages a more integrated analytics architecture. Data can be ingested, transformed, stored, modeled, reported, and analyzed within a unified environment. In this type of architecture, the semantic model becomes the final business-ready layer for reporting and AI consumption.
In the example model, the fact and dimension tables are configured with Direct Lake partitions, sourced from a Direct Lake connection. This is a modern analytics pattern where data is stored in a lake-based structure and exposed to Power BI through a semantic model, combining the speed of import with the freshness of DirectQuery.
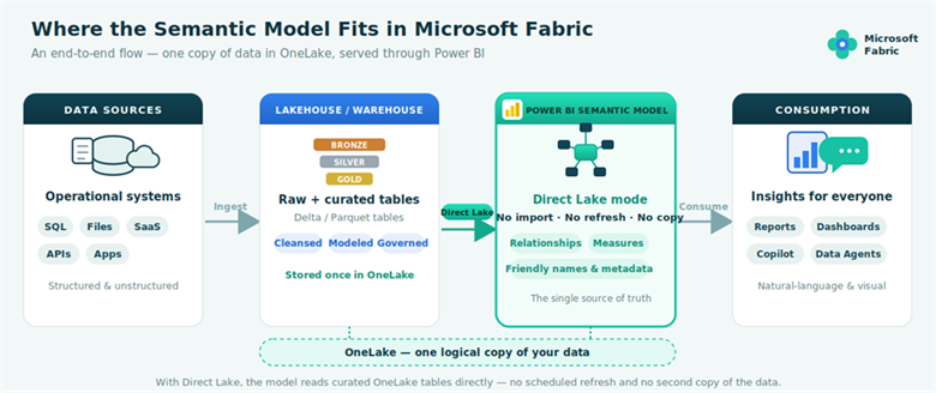
A typical Fabric-based architecture may look like this:
• Raw data is ingested into a Lakehouse or Warehouse.
• Data is cleaned, transformed, and structured into fact and dimension tables.
• Power BI semantic models are created on top of curated tables.
• Business logic is added through relationships, measures, metadata, and calculation rules.
• Reports, dashboards, Data Agents, and AI tools consume the semantic model.
This separation is important. Heavy data transformation should usually happen before the semantic model, while the semantic model should focus on relationships, business calculations, user-friendly fields, and analytics logic. For example, the Fact Sales Order Lines table should already contain clean transactional sales records, and the Dim Product table should already contain standardized product details. The semantic model should then define how these tables relate and how business metrics are calculated.
Deployment and maintenance are also important in modern analytics environments. A semantic model should follow a controlled release process, especially when it supports production reports. Recommended practices include:
• Separate development, test, and production workspaces
• Use deployment pipelines where appropriate
• Track model changes carefully
• Test measure outputs before release
• Validate relationships after schema changes
• Monitor refresh and query performance
• Document major business logic updates
As semantic models become reusable assets across multiple reports and AI experiences, governance becomes more important. A change in one measure can affect many reports. A new relationship can change filter behavior. A renamed column can affect users and downstream content. A modern semantic model should therefore be treated as a managed analytics product, not just reporting dependency.
Making Semantic Models AI-Ready
AI-readiness is one of the most important reasons to invest in semantic model design. AI tools need clear structure, business-friendly naming, accurate relationships, and descriptive metadata to generate reliable answers. In traditional reporting, users interact with predefined visuals. In AI-driven analytics, users may ask questions such as:
• What were the total sales last quarter?
• Which product category had the highest gross profit?
• Which store missed budget by the largest amount?
• What is the year-over-year sales growth?
• Which customer segment contributed the highest share of revenue?
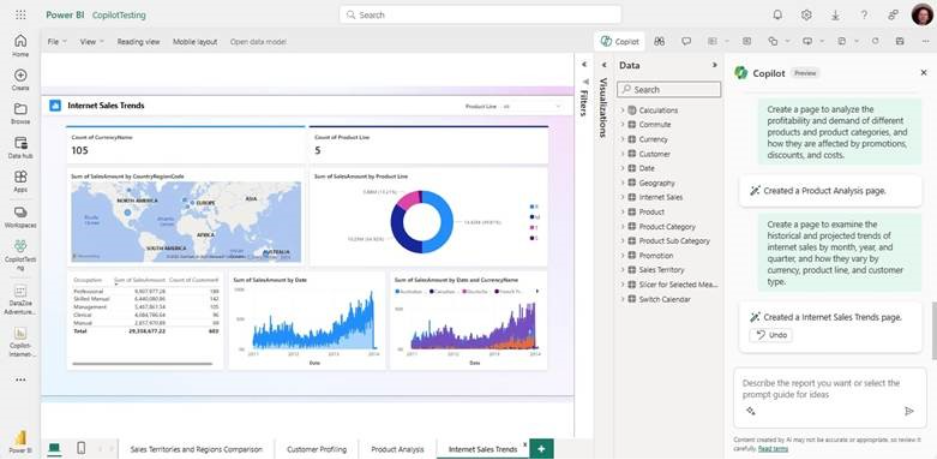
To answer these questions correctly, the AI must understand which tables and measures to use. A model with unclear names and duplicated logic creates risk. For example, if the model contains multiple sales-related fields such as Amount, Total Amount, Sales Amount, and Revenue, AI may not know which one represents the approved business definition. But if the model has a clear measure called Total Sales Amount, supported by a description, the AI has a better chance of selecting the correct metric.
The example model already includes several AI-friendly practices: business-friendly measure names, clear table names, hidden technical keys, centralized DAX measures, display folders for organization, a dedicated calendar table for time intelligence, shared dimensions for actual and budget comparison, descriptions on every table, column, and measure, and a Data Category set on the geographic Region field. To make and keep a model AI ready, apply the following practices consistently:
• Maintain descriptions on key objects. This model documents every table, column, and measure; for example, Sales vs Budget Amount % is described as the sales-versus-budget variance as a percentage of the budgeted amount. Keep these descriptions accurate as logic evolves, so AI always has the correct context.
• Hide unnecessary columns. Technical columns such as IDs and keys should remain hidden unless they are needed for analysis.
• Use approved measures instead of raw columns. Users and AI tools should be guided toward measures like Total Sales Amount, not raw numeric columns like Total Amount.
• Avoid ambiguous names. Names should clearly describe the business meaning of a field or measure.
• Create synonyms where useful. For example, users may say “revenue” instead of “sales amount.” Synonyms help AI interpret natural-language questions more accurately.
• Set data categories. Categorizing Region as Country/Region helps Copilot and map visuals interpret geography correctly.
• Document table grain. The model should explain that Fact Sales Order Lines is at order line level, and Fact Budget is at product-store-date level.
• Validate AI answers. Even with a strong semantic model, AI-generated responses should be tested against known report outputs and approved measures.
In the age of AI, the semantic model becomes more than a reporting structure. It becomes the business language layer that allows AI to understand enterprise data.
Design Principles: What Strong Semantic Models Get Right
A scalable semantic model reflects a set of deliberate design choices. The following principles separate models that hold up over time from those that require constant rework.
- Use a star schema instead of flat tables. A flat table may seem easier because all fields are in one place, but it often leads to repeated data, larger model size, slower performance, and less flexibility. Star schema keeps the model simple, performant, and maintainable.
- Prefer measures over calculated columns for business KPIs. Calculated columns increase model size because their values are stored in the model. Measures are calculated at query time and are better suited for aggregations and business logic that needs to stay flexible.
- Centralize business logic in the semantic model. When every developer writes their own version of sales, margin, or variance calculations, the organization ends up with inconsistent numbers across reports. Defining measures once in the semantic model ensures consistency.
- Keep relationships clean: one-to-many from dimensions to facts. Many-to-many relationships and bidirectional filtering may solve specific modeling problems, but they can introduce ambiguity and performance issues. A clean one-to-many structure is easier to understand, maintain, and interpret for AI.
- Hide technical fields from report view. Fields like CustomerID, ProductID, StoreID, and DateKey are important for relationships but are not useful in report visuals. Hiding them keeps the field list clean and steers both users and AI toward business-ready fields.
- Document the model. A model with descriptions is understandable to the original developer, the next developer, and AI tools. In AI scenarios, documentation directly improves the quality of generated answers.
- Design the model before building visuals. Building visuals before finalizing the semantic model creates report-level workarounds and unnecessary complexity. A stronger approach is to design the model first, validate the business logic, and then build reports on a solid foundation.
Conclusion: Semantic Models as the Foundation for Trusted BI and AI
A scalable Power BI semantic model is the foundation of trusted analytics. It connects raw data with business meaning, defines consistent calculations, supports reusable reporting, and prepares the organization for AI-driven analytics.
The example sales and budget model demonstrates these principles in practice: fact and dimension tables separated clearly, sales and budget sharing common dimensions, relationships following a clean star schema pattern, measures centralized in a dedicated _Measures table, business logic organized into display folders, technical keys hidden from report view, every table, column, and measure documented with a description, geographic fields categorized correctly, time intelligence built on a dedicated calendar table, and actual-versus-budget analysis supported through reusable measures.
These practices make the model easier to use, easier to maintain, and easier to scale. As AI capabilities continue to mature across Power BI, Copilot, and Fabric Data Agents, semantic model design becomes the single highest-leverage investment an organization can make in analytics quality. When the semantic model is clear, scalable, and AI-ready, every report, every user, and every AI experience becomes more reliable.
If you are designing semantic models for enterprise reporting, preparing your Power BI environment for Copilot and Data Agents, or building a scalable analytics foundation on Microsoft Fabric, the principles in this guide apply directly. Data Crafters works with finance and operations teams to design and implement production-grade semantic models. We can help you build the foundation.
References
• Understand star schema and the importance for Power BI – Power BI | Microsoft Learn
• Optimization guide for Power BI – Power BI | Microsoft Learn
• Direct Lake overview – Microsoft Fabric | Microsoft Learn
• Data categorization in Power BI Desktop – Power BI | Microsoft Learn
• Ask Copilot questions about your data – Power BI | Microsoft Learn
• Power BI Development Best Practices – RADACAD
• Preparing Power BI and Fabric for AI & Copilot – Paul Turley’s SQL Server BI Blog