
As discussed in our previous article (insert link), snapshots are essential for maintaining historical data and ensuring data integrity. However, manually taking snapshots can be time-consuming and challenging to manage. This guide will walk you through automating the snapshot process using a PySpark notebook in Microsoft Fabric. Let’s dive deeper into how this can be achieved.
Prerequisites
Before running this notebook, ensure the following:
- Fabric-enabled workspace: You need a workspace with Fabric capacity.
- Lakehouse: A Lakehouse must be set up within the workspace.
- API Data: Access to an API that provides the data you want to snapshot.
Step-by-Step Guide
Step 1: Get API Data
In this example, we will use currency data that is updated daily. To access the latest data, log in to freecurrencyapi.com and retrieve the API URL from the dashboard. Copy the URL and keep it handy, as we will use it in the notebook to fetch the latest currency rates.
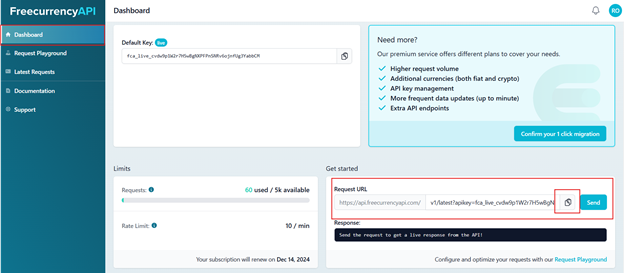
Figure 01: Get the API URL from freecurrencyapi.com
Step 2: Create Workspace and Lakehouse
We have created a Fabric-enabled workspace named “Snapshot” with F2 capacity. Within this workspace, we set up a Lakehouse also named “Snapshot.”
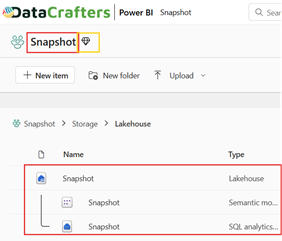
Figure 02: Create Workspace and Lakehouse
Note: If you are unfamiliar with how to create workspace with Fabric Capacity or setting up a Lakehouse, refer to the Microsoft guidelines for detailed instructions.
Next, open the Lakehouse “Snapshot” and create your first notebook.
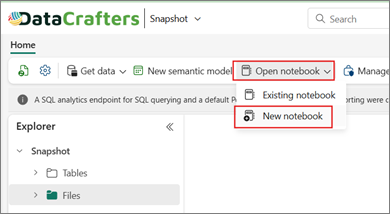
Figure 03: Create a New notebook
Give the notebook a meaningful name and, under the “Connect” dropdown, select “New Standard Session” to start a new session.
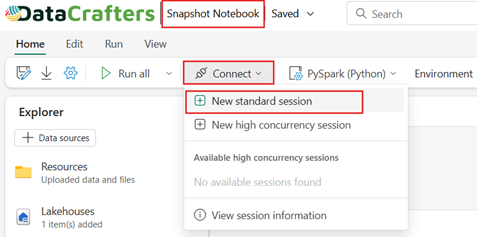
Figure 04: Connect with “New standard session”
Now, let’s prepare the scripts step by step.
Step 3: Import Required Libraries
import requests
from pyspark.sql.types import StructType, StructField, StringType, DoubleType, TimestampType
from pyspark.sql.functions import col, current_timestamp
Explanation:
- requests: Used to fetch data from the external API.
- pyspark.sql.types: Defines the schema for the Spark DataFrame, which helps create the table structure to store the data.
- pyspark.sql.functions: Provides helpful functions like col and current_timestamp for DataFrame transformations.
Step 4: Fetch API Data
api_url = "https://api.freecurrencyapi.com/v1/latest?apikey=fca_live_cvdw9p1W2r7H5wBgNXPFPnSNRv6ojnfUg3YabbCM"
response = requests.get(api_url)
data = response.json()
Explanation:
- api_url: Paste the copied API URL from freecurrencyapi.com
- response: Holds the response from the API.
- data: Converts the JSON response into a Python dictionary.
Step 5: Transform Structured Data
Next, we need to convert the API response data into a list of dictionaries
currency_data = [
    {"To": k, "Rate": float(v), "From": "USD"}
    for k, v in data['data'].items()
]
Explanation:
- From: Source currency (fixed as “USD”).
- To: Target currency.
- Rate: Exchange rate.
Step 6: Create Schema to Store Data
Define the schema for the table where the data will be stored. We will include a timestamp column to track when the snapshot was taken.
schema = StructType([
    StructField("From", StringType(), True),
    StructField("To", StringType(), True),
    StructField("Rate", DoubleType(), True),
    StructField("Date", TimestampType(), True)
])
Explanation:
- From: String (currency code).
- To: String (currency code).
- Rate: Double (currency exchange rate).
- Date: Timestamp (current date and time).
Step 7: Create Spark Dataframe
Create a Spark DataFrame using the predefined schema and add a new column “Date” with the current timestamp.
spark_df = spark.createDataFrame(currency_data, schema=schema)
spark_df = spark_df.withColumn("Date", current_timestamp())
Explanation:
- Spark_df: Creates a spark DataFrame with predefined schema (schema) and we add a new column “Date” with the help of withColumn properties.
Step 8: Check and Append Data
To avoid duplicating data, we need to check if the data already exists in the table before appending it.
table_name = "historicalcurrencyrate"

try:
    existing_table_df = spark.table(table_name)
    new_date = spark_df.select(col("Date").cast("date").alias("Date")).distinct()
    existing_dates = existing_table_df.select(col("Date").cast("date").alias("Date")).distinct()
    overlapping_dates = new_date.intersect(existing_dates)

    if overlapping_dates.count() == 0:
        spark_df.write.mode("append").saveAsTable(table_name)
        display("New Data Append")
    else:
        print("Data for the given date already exists. Skipping append.")
except Exception as e:
    spark_df.write.mode("overwrite").saveAsTable(table_name)
    display("Old Matched Data Overwrite")
Explanation:
- table_name: Stores the name of the table for easy reference.
Try:
- new_date: Extracts distinct dates from new data.
- existing_dates: Extracts distinct dates from the existing table.
- overlapping_dates: Compare dates to identify overlaps.
If:
- If no overlapping dates are found, append the new data to the existing table.
Else:
- Skips appending if overlapping dates are detected.
Except:
If the table does not exist, create it or update the matched data.
Step 9: Check Results
After running the script, verify if the data has been stored correctly.
spark.sql(f"SELECT * FROM {table_name}").show()Output:
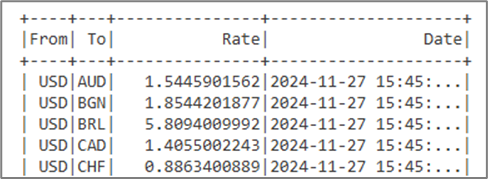
Figure 05: Sample Output
Suppose our requirements are to take the snapshot daily. To automate the process, schedule the script to run daily at a specific time. Click the three dots next to the script and select “Schedule.”
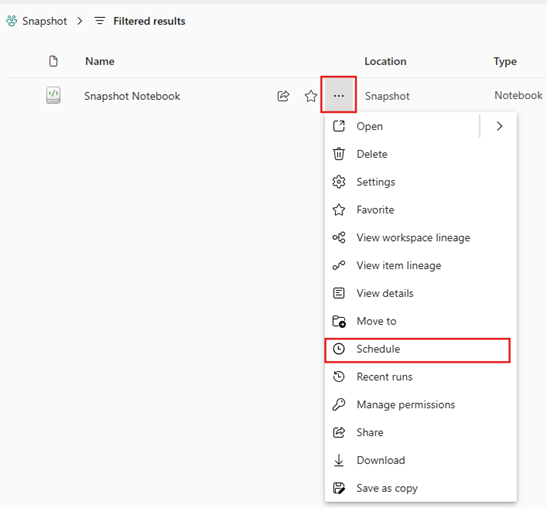
Figure 06: Create Schedule to run Daily
A side window will open where you can configure the schedule. Set the desired time (e.g., 10 AM) and click “Apply” to save the configuration.
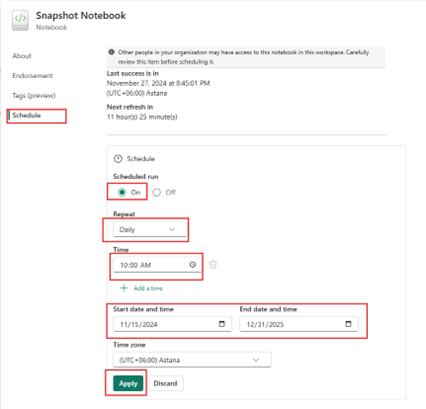
Figure 07: Set the schedule configuration for daily refresh at 10 AM
Conclusion
By implementing this approach, you can reliably capture and store the most recent data in a structured format, maintaining its historical context for analysis and informed decision-making. This process not only saves time but also ensures data integrity. In our next article, we will explore how to achieve similar automation using Dataflow Gen2. Stay tuned!
Read Part 3 : How to Build a Data Snapshot Pipeline with Dataflow Gen2 in Microsoft Fabric


